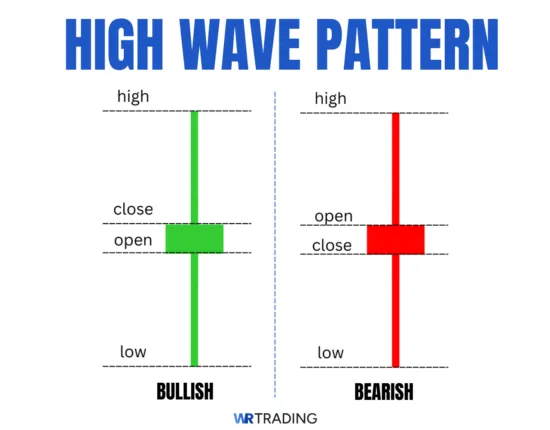
The High Wave candlestick is a single-bar pattern characterized by a small body and long wicks on both sides, showing that the price moved sharply in both directions but failed to close near either extreme. It shows hesitation in the market with strong activity in both directions, followed by a neutral close. The High Wave shows up after aggressive moves and can signal either exhaustion or a pause before continuation.
There are two forms of the High Wave. When it forms after a drop and the body closes slightly higher, it becomes a bullish High Wave, showing buying interest. When it forms after a rally and the body closes slightly lower, it’s a bearish High Wave, pointing to a potential loss of upward momentum. Neither version is predictive on its own, but both give you a clear signal that momentum is being questioned.
We found that traders use the High Wave pattern to identify indecision zones where they can wait for confirmation before entering a reversal trade, fading momentum, or tightening their stops around existing positions. Our guide breaks down how to read it properly, how to spot its most reliable versions, and how to turn that into a complete trade plan.
(Learn To Trade And Read Candlestick Patterns Like A Pro)
What Is A Bullish High Wave Pattern?
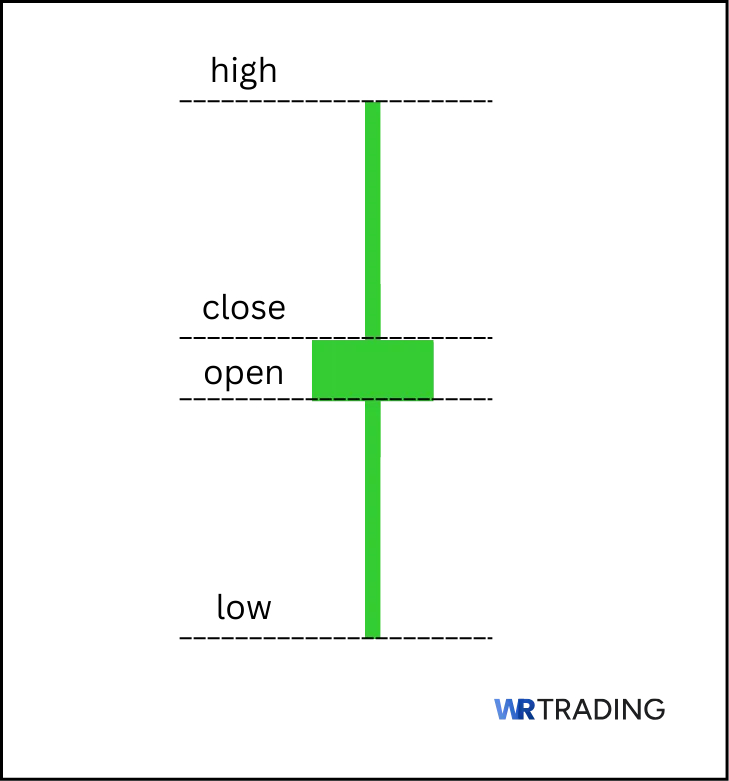
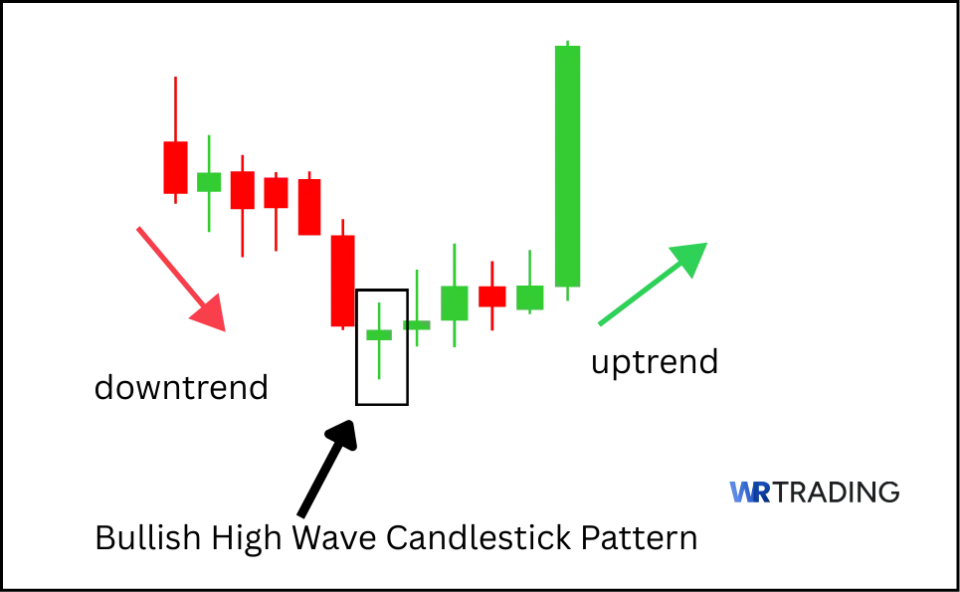
A bullish High Wave forms after a decline and signals hesitation in the selling pressure. The candle has a small body with long upper and lower wicks, but the body closes slightly higher, showing a rejection of lower prices. The price moves sharply in both directions during the candlestick’s formation, but buyers manage to close it near the upper half.
This shape indicates that sellers tried to continue the move down, but buyers stepped in and absorbed the pressure. It shows that the trend is no longer one sided, and momentum is starting to weaken. On its own, the candle does not confirm a reversal, but it marks a shift in control that often leads to a change in direction when backed by a strong setup.
You will usually spot a bullish High Wave after a strong drop, near a support level, or in a spot where the price is stretched. Traders watch it to prepare for a reversal, or at the very least, a stall in the downtrend. It signals that the market has lost its conviction, and something may be about to change.
Key Facts of The Bullish High Wave Candlestick Pattern:
- Type of Pattern: Single-candle bullish hesitation pattern.
- Construction Characteristics: The candle has a small green body with long upper and lower wicks. Both ends show strong price rejection, while the higher close hints at buying pressure pushing back.
- Trend Prior to Pattern: Forms after a clear downward move, often near areas where selling has already extended far without pause.
- Trade Forecast: Signals that sellers have lost control and buyers are starting to show interest. It often leads to either a reversal or a stall in the downtrend, depending on what follows.
- Interpretation: The pattern suggests the down move is no longer secure. Buyers have stepped in and disrupted the flow, leaving the market in a temporary state of balance that often precedes a bounce.
- Stop Loss Placement: Place your stop just below the low of the pattern. That wick represents the final push by sellers, and if the price breaks beneath it again, the pattern has failed.
- Opposite Pattern: The Bearish High Wave.
- Success Rate: 73% to 84%
What Is a Bearish High Wave Pattern?
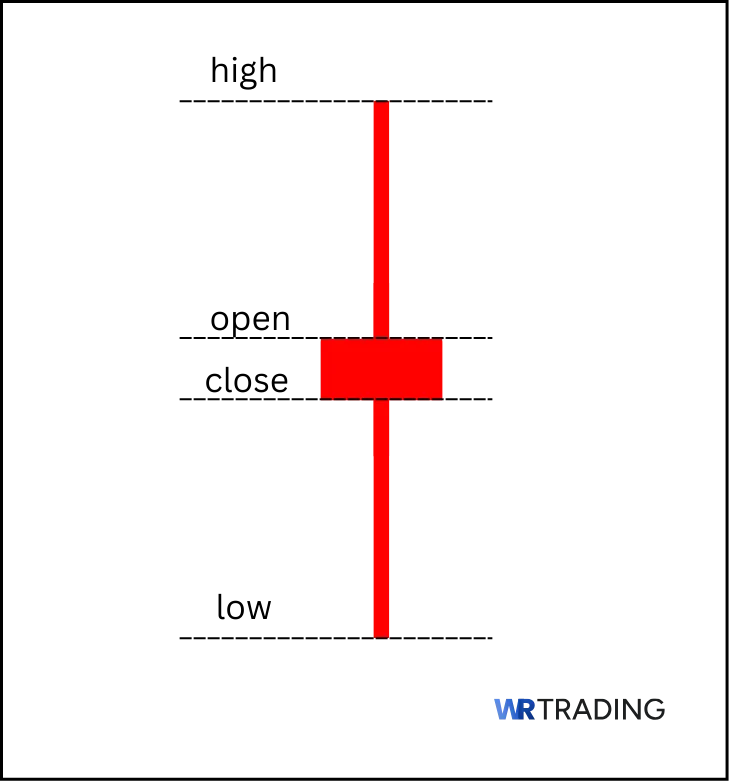
The bearish High Wave pattern is a single candlestick with a small body and extended upper and lower shadows. It appears after a strong bullish move and signals that upward momentum is weakening. The long wicks show that buyers and sellers were both active during the candle, but the close near the middle suggests hesitation rather than continuation. This type of High Wave warns that the market could reverse or stall, depending on what follows.
In bearish form, the High Wave pattern doesn’t trigger entries on its own. Instead, treat it as a warning that the trend may be slowing down. The moment the market stops respecting recent highs or buyers fail to hold ground, the bearish High Wave becomes useful as a signal to exit longs, tighten stops, or prepare for a potential downside move.
Key Facts of The Bearish High Wave Candlestick Pattern:
- Type of Pattern: Single-candle bearish hesitation pattern.
- Construction Characteristics: The candle has a small red body with long upper and lower wicks. The Price trades in both directions during the bar but fails to maintain any control by the close.
- Trend Prior to Pattern: Appears after sharp rallies or fast price expansions that haven’t seen a pullback or pause yet.
- Trade Forecast: Suggests a possible pause in bullish momentum or a full reversal if it forms at the top of a stretched move or near resistance.
- Interpretation: Buyers push the price higher during the candle but fail to keep control. Sellers match the strength, causing the candle to finish with a neutral or slightly lower close. This reflects balance returning to the market after a strong bullish move.
- Stop Loss Placement: Stops should be placed just above the candle’s high, if entering short on the next confirmation bar.
- Opposite Pattern: The bullish High Wave.
- Success Rate: 73% to 84%
(Learn To Trade And Read Candlestick Patterns Like A Pro)
How Does a High Wave Candlestick Pattern Form?
The Bullish/Bearish High Wave completes within a single candlestick, which means it only takes one chart interval to form. On a 1m chart, it will take one minute. On a 4h chart, it will take four hours.
The meaning of the pattern stays the same across timeframes, but its potential increases as you move higher. High Wave candles on daily or weekly charts tend to show more significant hesitation and broader sentiment shifts.
Bullish High Wave:
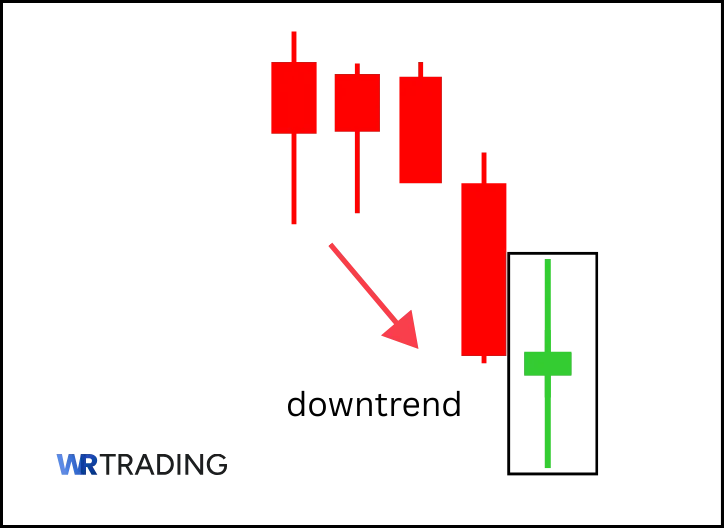
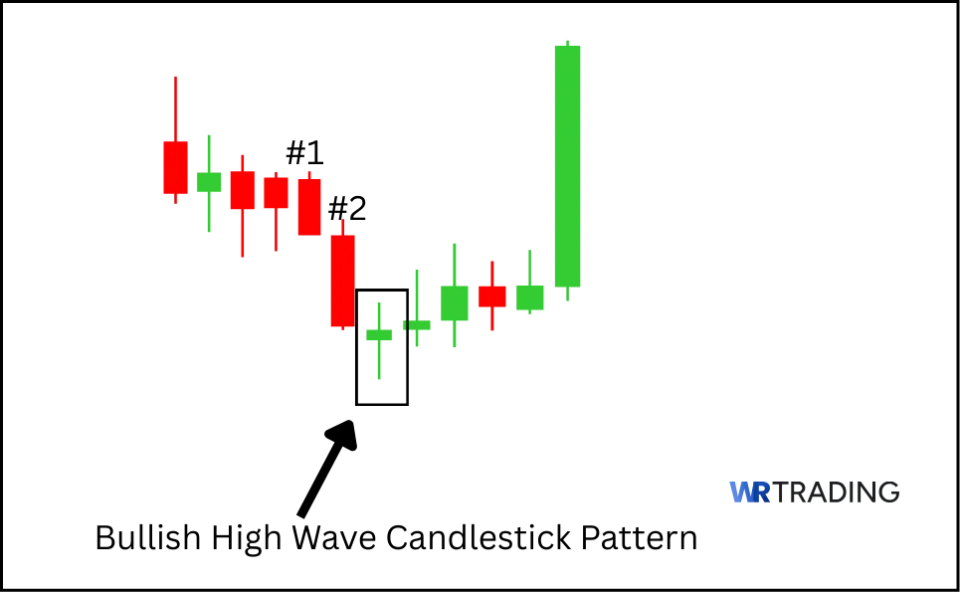
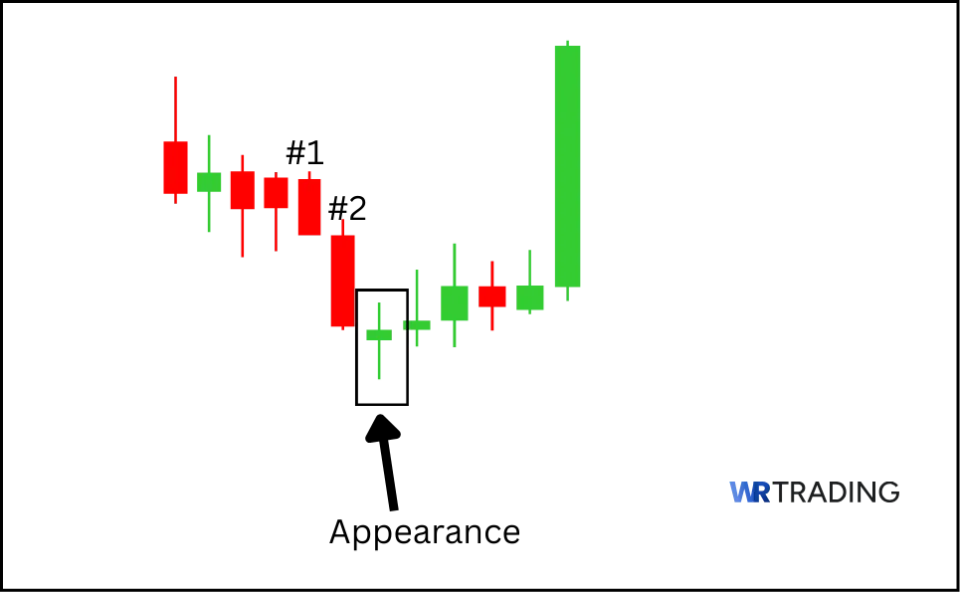
In a bullish setup, the High Wave shows up after one or two red candles that have moved the price downward with strength. When the High Wave appears, it has a small green body and long wicks extending in both directions, showing that the market is unsure whether to continue lower or reverse. That pause creates a possible shift in momentum. A green candle that follows and closes above the High Wave confirms that buyers have stepped in and are taking control.
Bearish High Wave:
The Bearish High Wave comes after a stretch of green candles pushing higher. The High Wave then prints a small red body, again with long wicks, showing that buyers tried to continue the move but were met with strong pressure in a downward direction.
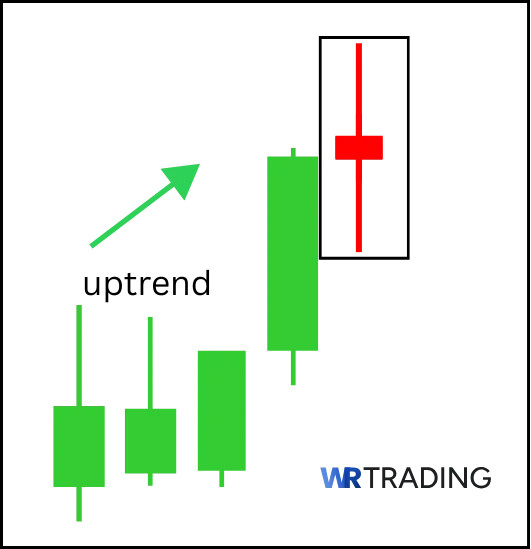
The failure to close near the top signals hesitation, not commitment. If the next candle breaks below the pattern and closes with strength, it confirms that sellers have taken over and the previous move is losing power.
What Does the High Wave Candlestick Pattern Mean?
The High Wave pattern tells you that momentum has hit a wall and traders are unsure about what to do next. After a strong move in one direction, this candle marks the point where control becomes unclear, and the price gets pushed in both directions during the candlestick formation.
That level of back-and-forth without a decisive close indicates the balance between buyers and sellers is evenly matched, which often signals a moment of indecision before the market chooses a direction. Instead of clear conviction, the market hesitates and that pause often leads to the next wave, depending on which side breaks the deadlock.
In practical terms, this means the High Wave doesn’t give a trade signal by itself, but it raises a flag. If you see it after a run-up in price and then the next candle closes lower, that becomes a sign that buyers may be giving up. The opposite applies after a steep fall, if the market prints a High Wave followed by a strong green candle, it confirms that demand is returning.
Where does the name of the High Wave Pattern Come From?
The name “High Wave” comes from how the candle looks. Its long wicks on both sides create the image of a wave rising and falling before settling in the middle. That wide movement up and down, without a strong close in either direction, is what gives the pattern its “High Wave” label.
(Learn To Trade And Read Candlestick Patterns Like A Pro)
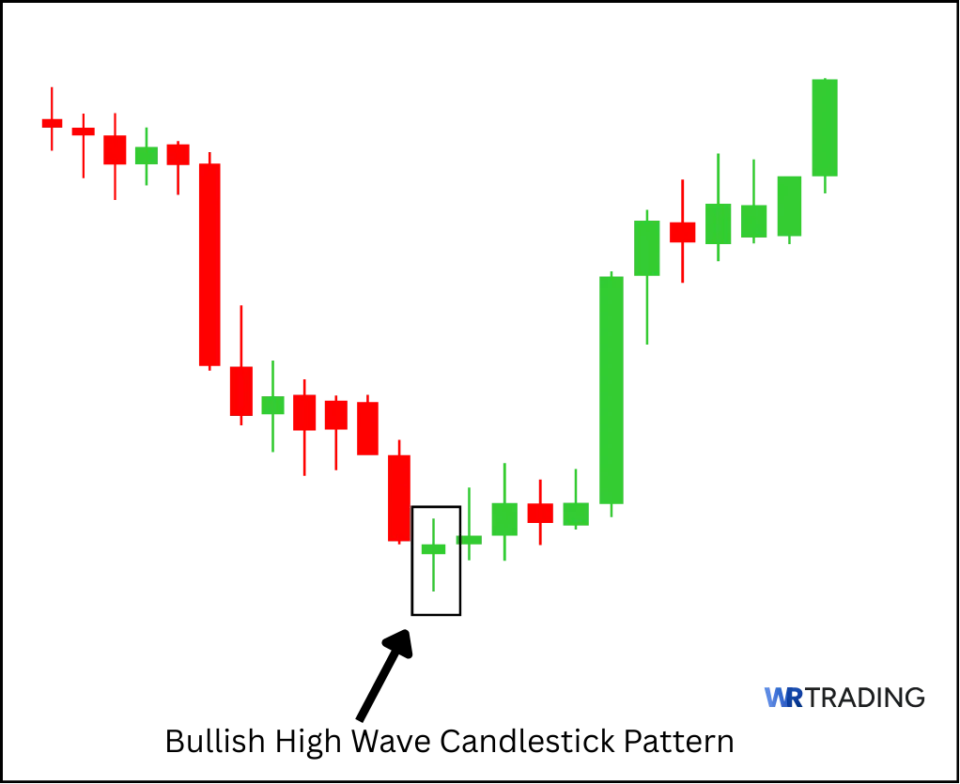
Example of the High Wave Pattern in the Chart
How to Identify a High Wave Candle in the Chart?
To Identify the High Wave start by checking where the candle forms in relation to the previous price action since the bullish or bearish variations show up after strong trends, either upward or downward.
What you want to see is a single candle where the price travels sharply in both directions but ends up closing near its opening level, creating that narrow body between extended upper and lower shadows. The height of the candle is large compared to its neighboring candles, but the body is small, making it stand out visually.
The most reliable High Wave patterns show up at key turning points like near support during a down move or near resistance after a climb. You’ll find them at moments when momentum is already looking overextended, and traders on both sides start taking profits or hesitate to push the move further.
You can confirm it’s a High Wave candle when it clearly rejects both directions and leaves a body that’s centered between two prominent wicks. It’s not enough for it to be volatile; it has to leave the market in a state of visible hesitation.
How to Trade the High Wave Candlestick Pattern
The High Wave pattern is a hesitation signal, and because of that, it’s not meant to be traded on its own. It works best when you combine it with other tools that help confirm whether the market is likely to continue or reverse. Here’s our full breakdown showing you how to use both the bullish and bearish versions in a practical setup:
- Find the Right High Wave Candlestick Pattern Setup
- Wait for the Appearance of the High Wave Candle
- Open Your Trade – Entry Point
- Wait For A Confirmation Or Not
- Choose Your Trading Take Profit
(Learn To Trade And Read Candlestick Patterns Like A Pro)
1. Find the Right High Wave Candlestick Pattern Setup
Before trading the High Wave, make sure the candle is forming in a place where it makes sense. This pattern doesn’t give you much unless it shows up where traders are already starting to hesitate. Look for it at major zones like long-standing resistance, stretched trendlines, or spots where the move has been sharp and sudden without any pause.

Here are the most common setups where the High Wave pattern becomes meaningful:
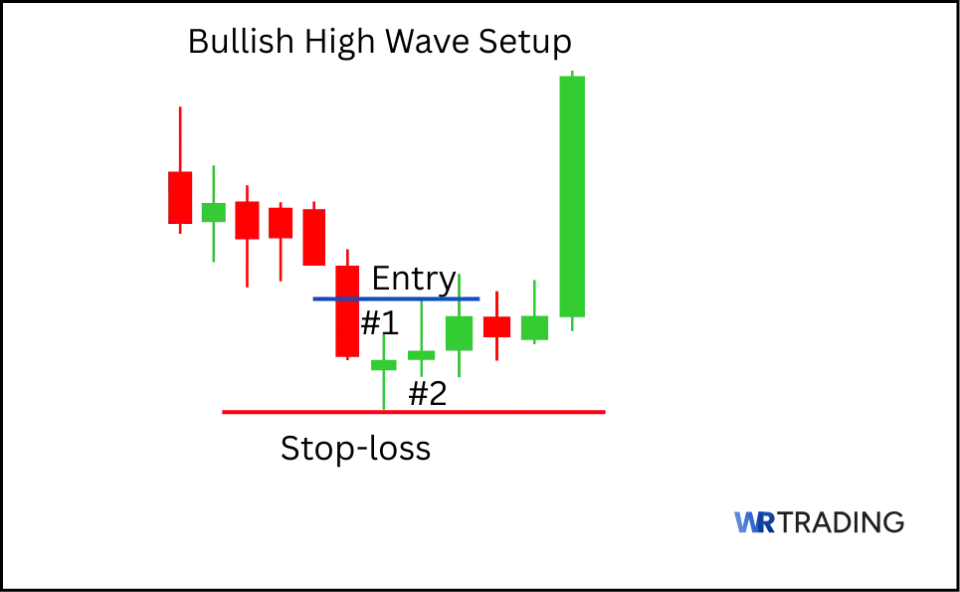
- Bullish High Wave: After a strong selloff, ideally when the price hits a daily or weekly support level or breaks below a recent low and immediately stalls. If momentum dries up right after a breakdown, the bullish version signals that sellers have run out of pressure.
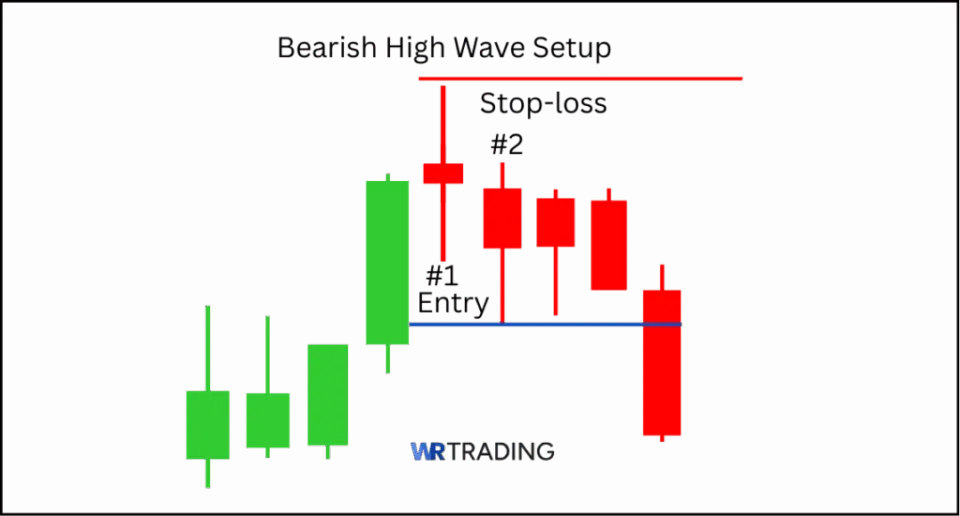
- Bearish High Wave: After a rapid rally that hits resistance or breaks above a recent high, but then fails to continue. A long upper shadow here followed by a tight body shows that buyers are no longer in control.
- Reversal Setups: Look for areas where RSI has gone below 30 (bullish setup) or above 70 (bearish setup), and the High Wave appears around the same time. This adds a layer of exhaustion confirmation.
- Continuation Setups: You’ll occasionally find the pattern in pullbacks or pauses within the trend. In that case, the candle shows a brief moment of consolation before the trend resumes but only if confirmed by volume or another tool.
Always zoom out and check the larger trend. The candle on its own means nothing without understanding what came before it and what part of the trend cycle you’re in.
2. Wait for the Appearance of the High Wave Candle
Next, you need to recognize the High Wave in real time, not just after the fact since you want to enter a position early to receive the most profits. Wait until the candle has fully formed and closed with long upper and lower shadows and a tight body near the middle of the range. There should be at least two sharp wicks that reach above and below the surrounding price action. If the body closes slightly higher, it’s a bullish High Wave; if it closes lower, it’s the bearish version.
Use TradingView or your preferred charting platform and wait for the full candle to close on your timeframe. For most High Wave patterns, the 1-hour and 4-hour charts give the best balance between reliability and tradeable signals. Daily candles work even better for swing trading, but you’ll need more patience to wait for the candlestick to complete.
If you want to avoid weak signals, use the Average True Range (ATR) set to 14 periods to check if the candle’s total range is larger than average. A good High Wave will usually stand out with a range that’s bigger than the last five candles combined.
3. Open Your Trade – Entry Point
Once the pattern forms at the right place, and you’ve confirmed the candle shape, it’s time to plan your entry. The High Wave is not a strong entry signal on its own. You want the market to prove it agrees with the hesitation you’ve seen. That means you need some kind of follow-up confirmation before pulling the trigger.
Here are a few ways you can set up your entry:
- Bullish High Wave: Wait for a close above the candle’s high on the next bar. That shows buyers have stepped in and are now taking control. Enter long after the break and place your stop just below the wick.
- Bearish High Wave: Wait for a close below the candle’s low. This means sellers are now confirming that the upward push has failed. Enter short once the level breaks and keep your stop just above the high of the pattern.
To improve your odds of a successful trade, use a volume spike confirmation. If the candle that breaks the pattern’s range comes with a noticeable rise in volume (use Volume or On Balance Volume indicator), that’s a stronger sign that the move is real. If volume stays low, be cautious as this might just be noise.
4. Wait For A Confirmation Or Not
Confirmation is optional depending on your risk style, but in most cases, it gives you a more reliable entry. The best confirmations come from a combination of price action and indicators. These are some tools you can use for extra confirmation:
- MACD (12, 26, 9): Apply the MACD after spotting a High Wave pattern by checking if the MACD line is crossing above the signal line for a bullish setup or crossing below it for a bearish one. This should happen within one or two candles after the pattern appears. A growing histogram in the same direction as your trade adds further weight to the confirmation. The signal becomes stronger when this crossover also occurs above the zero line in bullish setups or below it in bearish setups.
- Stochastic Oscillator (14, 3, 3): Use the stochastic to track whether the price is moving out of extreme conditions. In a bullish scenario, both lines should rise cleanly from below the 20 level, while in a bearish setup, they should fall sharply from above 80. The slope of the lines matters since sharp movement shows that momentum is backing your trade.
- Volume: Measure the strength of the breakout using volume on the candle that follows the High Wave. A clear increase compared to the previous few candles shows that traders are committing to the move. This applies in both bullish and bearish directions. When volume stays low, it signals hesitation and makes the pattern less reliable, so it’s better to wait for confirmation before acting.
However, you can choose to enter without confirmation to catch early moves, but this comes with a lower win rate. If you’re trading without confirmation, use smaller position sizes or a tighter stop to manage the extra risk.
5. Choose Your Trading Take Profit
Take-profit placement should reflect the strength and direction of the pattern that came before it. A bullish High Wave forming after a strong drop into support can lead to a bounce, but it often runs out of momentum quickly. In those cases, targeting the nearest swing high or broken structure level gives you a safer exit. Stretching the target beyond that creates risk without enough backing from the pattern itself.
Bearish High Wave setups work the same way in reverse. After a rally that loses momentum, this candle often shows up near key resistance or after a fast move that didn’t retrace. The next red candle confirms the shift, but profit should be taken at the first strong support level below. If the market was already stretched, you might get more, but don’t count on it.

Here are a few ways to plan your take profit:
- Fixed Risk to Reward: Aim for a 1:2 or 1:3 reward ratio based on your stop-loss. If your stop is 20 points, set your take profit at 40 or 60 points depending on the strength of the move.
- Next Support or Resistance: Use recent swing highs or lows as realistic targets. If your bullish High Wave formed at a major low, look for the last minor resistance as your target. If it formed at a top, use the last swing low as the target.
- Trailing Stop: Use a moving average like the 9 EMA or the Parabolic SAR to trail your position. This works well in strong trending moves where the High Wave is just the first signal in a larger shift.
(Learn To Trade And Read Candlestick Patterns Like A Pro)
Which Strategies Can Be Used For The High Wave Candlestick Pattern?
The High Wave candlestick pattern does not work well in isolation and it needs confirmation and the right context to offer any real trading opportunity. Many traders fail with it simply because they try to trade it like a reversal signal without understanding the structure that supports it. To trade it effectively, you must place it inside a proper plan, use tools that support your read of the chart, and choose a strategy that matches your overall bias.
- Reversal After Exhaustion in a Trend
- Pullback Continuation Entry
- Trap Setup at Major Support or Resistance
1. Reversal After Exhaustion in a Trend
Strong trends often overextend, leading to a fast final push that wipes out late entries. When momentum slows and a High Wave forms at the top or bottom of a long run, it can signal exhaustion. That hesitation bar, with long wicks and a tight close, shows the market has reached an area where buyers or sellers no longer have full control. If a strong candle follows in the opposite direction, it confirms that the previous trend has likely peaked.
You can pair this pattern with RSI to gauge overbought or oversold conditions. When RSI prints above 70 during an uptrend and you spot a bearish High Wave, it shows a likely reversal zone. Use a break below the low of the High Wave for confirmation and place your stop above the wick. In a downtrend, wait for RSI to dip under 30 and then look for a bullish High Wave. Once confirmed, target the next minor resistance and exit before the move loses steam.
2. Pullback Continuation Entry
The High Wave pattern can act as a short pause during pullbacks. In an uptrend, a small cluster of red candles might be followed by a High Wave that signals hesitation before the trend resumes. The long wicks tell you that both sides tested the waters, but neither was strong enough to dominate. Once a green candle closes above the High Wave, it often opens the way to a continuation entry with momentum.
Place a moving average, like the 20 EMA, on your chart and wait for the High Wave to touch or hover near it. This setup works best when the pattern forms just above the average during an uptrend or just below it in a downtrend.
Confirmation comes when the price breaks the high or low of the High Wave with strength and closes above it. This reduces the chance of fading into a reversal and instead keeps you in the direction of the larger trend.
3. Trap Setup at Major Support or Resistance
Sometimes traders get caught leaning too far into a move when a level looks ready to break. The High Wave pattern can act as a trap signal when it forms directly on a major support or resistance zone. Those long wicks show that the price tried to break the level, failed, and returned to the middle, leaving early breakout traders exposed. A follow-through in the opposite direction creates a clean entry with trapped traders providing momentum.

Mark clear support or resistance zones on your higher timeframe chart, then wait for the price to tag those levels and print a High Wave pattern. If the breakout attempt is met with hesitation and volume drops, look for the next candle to move strongly in the opposite direction. You can enter on that confirmation and set your stop just beyond the wick of the High Wave. This gives you a strong risk-reward setup built on a failed breakout.
(Learn To Trade And Read Candlestick Patterns Like A Pro)
What Is The Success Rate Of The High Wave Candlestick Pattern?
In our experience, the High Wave Candlestick has a high success rate ranging from 73% to 84%. Unfortunately, there are no formal studies or backtests available that measure the success rate of the High Wave candlestick pattern. It has not been included in research from major sources like Bulkowski or independent trading firms.
However, many traders report better results when the pattern forms at key turning points, such as major support or resistance, or after an extended trend. The odds improve when the High Wave appears with volume support and is followed by a decisive confirmation candle in the direction of the anticipated move.
Is the High Wave Candlestick Pattern Suitable For Beginners?
Yes, the High Wave candlestick pattern can be suitable for beginners, but only under specific conditions where context, confirmation, and basic price action reading are part of the approach. On its own, the pattern is not reliable enough to be used by new traders without the risk of misreading the signal since it does not provide clear direction and often appears during periods of uncertainty.
Beginners are more likely to make mistakes with this setup if they treat it as a standalone signal or fail to wait for confirmation. The most important part that makes the pattern manageable for less experienced traders is how well they can follow a structured checklist.
This includes identifying whether the High Wave appears after a sharp move, checking the surrounding price structure for support or resistance, and waiting for a breakout or follow-up candle to provide actual direction.
What Are the Pros and Cons of Trading the High Wave Candle Pattern?
The High Wave pattern offers some clear advantages for new traders, such as it’s easy to recognize and shows market hesitation in a way that stands out on any chart. It helps highlight exhaustion points, gives structure to reversal setups, and works well across different timeframes.
However, the pattern also brings challenges, like the direction is never obvious, and it means very little without proper context. You may jump in too early without waiting for confirmation or overlook key signals like volume. Used carefully, it can be helpful, but on its own, it offers no guarantee of success.
Here are some of the pros and cons we’ve came across during our trading experience:
Pros
- Spots Market Hesitation Visually
- Appears at Exhaustion Points
- Helps Setups for Reversal Trades
- Works Across Multiple Timeframes
- Useful for Managing Active Trades
Cons
- Direction Is Never Clear on Its Own
- Appears Often but Means Very Little Without Context
- Confirmation Candle Is Mandatory for Entry
- Volume Often Ignored When Interpreting the Pattern
- Tempts Beginners to Enter Too Early
What Are The Advantages Of The High Wave Pattern?
The High Wave pattern is most valuable for what it reveals about the balance of buyers and sellers in the market. Its long wicks and small body show hesitation at key moments, often highlighting potential exhaustion or reversal areas. While it needs context to work, the pattern helps you manage existing trades, time entries with confirmation, and gauge momentum shifts when paired with the right tools and structure.
- Spots Market Hesitation Visually: The High Wave is one of the clearest visual patterns for showing indecision. The long wicks on both sides indicate aggressive movement in both directions, while the small body shows that neither side could win control. This tells you to pause and assess the conditions rather than blindly continuing with the current bias.
- Appears at Exhaustion Points: The High Wave tends to form at the end of strong directional moves when the market has covered a lot of ground in a short time. Whether it follows a sharp rally or a steep decline, its appearance signals that the move may have run out of momentum. That makes it a useful for planning reversals or tightening risk.
- Helps Setups for Reversal Trades: When paired with the next candle, the High Wave can signal the beginning of a new trend or retracement. If the follow-up candle confirms the reversal by closing above or below the High Wave, it provides a structured entry point. This is helpful when trading against overextended trends.
- Works Across Multiple Timeframes: The High Wave is not limited to a specific timeframe, and it can show meaningful information on intraday, daily, or even weekly charts. When it aligns across more than one timeframe, it offers stronger signals. This allows you to apply it to different styles of trading, whether short-term or swing.
- Useful for Managing Active Trades: If you are already in a trade and see a High Wave form, it can help you decide when to tighten stops or prepare for a possible exit. Its presence signals that the momentum is slowing down and that the market may be ready to reverse or consolidate. That information can help protect profits or reduce drawdowns.
What Are The Disadvantages Of The High Wave Pattern?
The High Wave can be deceptive if you trade it without confirmation or expect it to predict direction on its own. Many traders fall into the trap of reacting too quickly without waiting for confirmation or checking structure. Its overuse in the wrong conditions, lack of clear bias, and frequent appearance in low-quality setups make it a pattern that requires trading experience to apply correctly.
- Direction Is Never Clear on Its Own: The High Wave gives no bias toward bullish or bearish continuation. You need to wait for the next candle to confirm whether buyers or sellers are taking over. Entering based on the High Wave alone usually results in guesswork, not planned trading.
- Appears Often but Means Very Little Without Context: The High Wave is an uncommon pattern, and many of them appear in random places with no real significance. In sideways or quiet markets, it may just be noise. Traders who act on every appearance without checking trend strength or levels get caught in bad trades.
- Confirmation Candle Is Mandatory for Entry: The High Wave means nothing without the candle that follows it. Unless the next candle shows strength in a clear direction, the setup remains neutral and incomplete. Many failed trades come from acting before that confirmation appears.
- Volume Often Ignored When Interpreting the Pattern: If the High Wave appears on low volume, it may not reflect real indecision at all. It could simply be a temporary lack of liquidity. Volume helps you validate whether the market is genuinely undecided or just pausing due to inactivity.
- Tempts Beginners to Enter Too Early: New traders often get excited by the dramatic shape of the High Wave and treat it like a signal to trade. That impatience leads to early entries and losses. It takes discipline and experience to use this pattern correctly inside a larger plan.
Can the High Wave Pattern Have Failure Signals?
The High Wave pattern can be easy to spot, but it is also easy to misunderstand. You may rush into trades the moment you see the long wicks and small body without stopping to ask what the candles around it are implying. Others rely on the pattern alone without using any confirmation tools, which leads to poor entries and inconsistent results.
If you want the High Wave to work for you, you need to be selective, wait for context, and apply it as part of a full trading plan. These are the most common mistakes we’ve come across and exactly how to avoid them.
- Entering Without a Confirmation Candle: Jumping in immediately after a High Wave prints will usually leave you stuck in a range or on the wrong side of the next move. You must wait for a strong candle that confirms direction, such as a full-body close that breaks the High Wave’s range with volume. Confirmation separates setups that are just noise from those that actually matter.
- Ignoring the Trend or Structure Around the Pattern: The High Wave does not function in isolation, so look for whether the price was trending or stretched before the pattern forms, and always mark nearby support and resistance zones. This helps you avoid taking signals in the middle of nowhere, where the price is just ranging or churning sideways.
- Assuming It Will Reverse the Market on Its Own: The pattern signals indecision, not reversal. It only becomes useful when combined with strong price structure and directional clues from other tools. Always ask yourself why the market might turn and whether the High Wave is actually reacting to something important.
- Using the Same Entry Rules for All Market Conditions: The High Wave works best at exhaustion points or near known levels, but it will not behave the same in every environment. In trending markets, it may just be a pause before continuation. In consolidations, it may be a failed breakout or just another whipsaw. Always adjust your trade logic based on the bigger picture.
- Trading Without Volume or Momentum Tools: If you are not using volume, RSI, MACD, or something similar, you are missing half the picture. These tools help you see if the market is still building energy or starting to unwind. A High Wave with falling volume is not the same as one with a surge of interest just before it prints.
- Forcing the Pattern in Small Timeframes: The High Wave appears too often on one-minute and five-minute charts, which makes it harder to filter. Higher timeframes give you more context, cleaner signals, and less noise. Wait for setups on at least the fifteen-minute chart and always confirm with higher timeframe levels.
- Taking It at Face Value Without Planning an Exit: Even a perfect entry means nothing without a proper exit strategy. Use the range of the High Wave as a reference for your stop and aim for at least a one-to-one reward to risk. Don’t let the shape of the candle distract you from managing the trade with structure and discipline.
(Learn To Trade And Read Candlestick Patterns Like A Pro)
Which Indicators Can Be Combined With The High Wave Pattern?
The High Wave pattern gives you a visual sign of indecision, but it does not tell you what to do next unless it is backed by other tools. When used alongside specific technical indicators, the pattern becomes far more reliable. Indicators help confirm the strength of the breakout, measure momentum behind the move, and add timing to your trade entries.
Relative Strength Index (RSI) set to 14
The RSI helps confirm momentum shifts after the High Wave has printed. In a bullish setup, the pattern forming near oversold levels followed by RSI crossing above 30 can act as an early confirmation of buying strength.
When trading bearish setups, look for the RSI to turn lower from overbought levels and cross under 70, which helps confirm that bullish momentum has lost momentum and sellers are now driving the price.
MACD with settings 12, 26, 9
MACD gives you strong confirmation once a crossover follows a High Wave signal. For bullish setups, wait until the MACD line crosses above the signal line with both lines below the zero mark, indicating a possible trend reversal from negative to positive momentum.
Bearish setups work the opposite way, where a downward crossover after the pattern suggests growing selling strength and a likely move lower.
Basic Volume Bars or Volume Profile Tool
Volume helps you decide if a breakout after the High Wave pattern has conviction or not. Watch for a visible increase in volume on the candle that breaks above or below the High Wave range, which adds weight to your trade decision. When volume stays low during or after the pattern, it suggests the market is still undecided and may not follow through with any real momentum.
Bollinger Bands set to 20 period and 2 standard deviation
When the High Wave candle touches or pierces the outer band and closes back inside, it can act as a warning that the market has stretched too far and may reverse. You can also use this tool to see when the market is coiling, as the pattern forming inside squeezed bands often appears before a volatility expansion. Wait for the next candle to break out of the band with volume to support your entry.
What Are Similar Patterns To The High Wave Pattern?
Many candlestick patterns signal hesitation, exhaustion, or shifts in control, but not all carry the same meaning. The High Wave stands out because it compresses intense market activity into a single candle, with both sides being tested before the market stalls. To understand what makes it unique, it helps to compare it to similar patterns that also deal with indecision, reversals, or emotional price swings.
| Pattern | Main Characteristics | Best Use Case |
|---|---|---|
| Doji | A one-candle pattern with virtually no body and equal or near-equal wicks on both sides, highlighting a lack of clear control from either side. | Works best during low-volume environments or slow sessions where the price stalls completely. It is less expressive than the High Wave and doesn’t always appear after large movements. |
| Spinning Top | A one-candle pattern featuring a small body with short wicks on both sides, suggesting mild hesitation rather than strong conflict between buyers and sellers. | Most effective during range-bound conditions or in slow trends where the price lacks momentum. It is a softer version of the High Wave, making it less useful at key turning points. |
| Hammer | A one-candle bullish reversal with a small body near the top and a long lower wick, forming after downward movement to show strong buying rejection. | Best used after sharp declines when buyers start absorbing selling pressure. Unlike the High Wave, the Hammer carries a clear bullish message and works well at local bottoms. |
| Inverted Hammer | A one-candle formation with a small body near the bottom and a long upper wick, showing an upward test followed by rejection during a downtrend. | Most reliable when it appears near support or after extended selling. It does not show two-sided rejection like the High Wave and instead focuses on upside rejection alone. |
| Shooting Star | A one-candle bearish reversal with a small body near the low and a long upper wick, often forming after aggressive upward pushes. | Works best at the top of bullish swings where buying momentum begins to fade. It signals bearish intent clearly without needing confirmation from a follow-up. |
Learn more about candlestick patterns and download our free candlestick pattern cheat sheet PDF.
What Is The Opposite Pattern Of The High Wave?
The opposite of the High Wave is a Spinning Top, which is a one-candle pattern that shows indecision in the market but with lower intensity than other signals. It forms when the body is small and centered, with equal wicks on both ends, meaning the price moved in both directions but settled close to where it started. This balance between buyers and sellers shows hesitation rather than exhaustion and usually shows up during slow or uncertain periods.
You’ll find Spinning Tops during consolidations or at points where the trend is losing momentum. On its own, it doesn’t carry enough weight to trigger a trade, but it does alert you that momentum is stalling. Traders watch the candle that follows to confirm whether the price is likely to break out or continue drifting.
What Is the Difference Between a Bullish High Wave and a Bearish High Wave Pattern?
The High Wave candlestick does not lean bullish or bearish when it forms and it stands as a neutral signal until the market decides what to do next. What gives it direction is the price action that comes directly after. When the pattern follows a clear down move and is confirmed by a strong green candle that breaks above its high, it becomes a bullish High Wave.
On the other hand, when it forms after a steady rally and is followed by a red candle that breaks its low, it turns into a bearish version. This shift is not about the color of the High Wave itself but about what happens next.
The difference between the bullish and bearish versions is their placement and confirmation. Both versions have the same construction, a narrow body and long wicks on both sides, but they appear in different parts of the trend. The bullish version comes after aggressive selling where buyers start to push back, while the bearish version forms after a wave of buying that begins to lose strength.
They are mirror images in terms of market context. However, without the candle that follows, neither version has a clear message, which is why traders never act on it alone.
| Section | Bullish High Wave | Bearish High Wave |
|---|---|---|
| Main Characteristics | The pattern forms after a strong decline, showing that sellers are no longer in full control. Buyers begin testing the downside, leading to a moment of hesitation. | The pattern shows up after an aggressive rise. Buyers push hard but fail to hold the highs, as sellers begin rejecting price, leaving a candle of indecision. |
| Construction | One candle with long upper and lower wicks and a body near the center. The direction is unclear until the next candle closes above the range with strength. | Same one-candle structure, with extended wicks on both ends and a small body. A bearish signal forms when the next candle breaks lower with clear momentum. |
| Forecast | Suggests that the downward pressure may be fading. Traders wait for a breakout to the upside to confirm a possible reversal or start of a rally. | Points to a pause in upward momentum. Confirmation comes when the price breaks below the pattern, often marking the start of a correction or new trend down. |
| Type of Pattern | A one-candle hesitation pattern | A one-candle hesitation pattern |
| Trend Prior to Pattern | Occurs after sustained selling or sharp downswings. The High Wave signals a possible turning point or a slowdown in bearish strength. | Found after strong bullish moves or breakouts. The High Wave shows that buyers are struggling to push further, and the next move may reverse the prior trend. |
| Best Use Case | Used at the end of fast drops to prepare for a potential bounce or reversal. Traders watch for bullish confirmation before taking action. | Most useful after parabolic rallies or overextended trends. Traders use it to wait for a confirmation candle to short or reduce long exposure. |
(Learn To Trade And Read Candlestick Patterns Like A Pro)
What Is The Difference Between A High Wave Pattern and A Spinning Top?
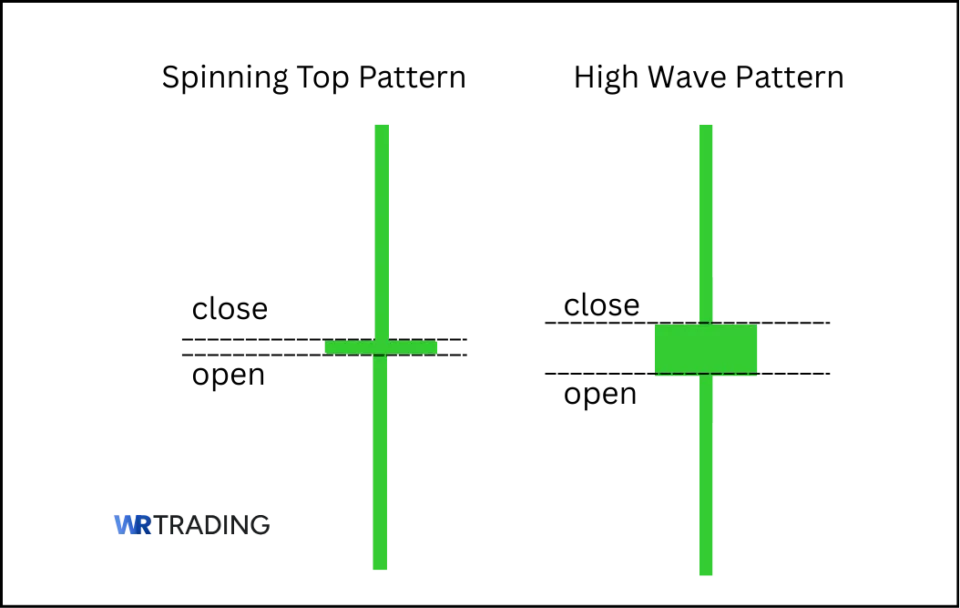
The High Wave and the Spinning Top are both single-candle patterns, but they do not have the same construction. The High Wave has a much more dramatic appearance, with long upper and lower wicks that show the price was pulled aggressively in both directions. The Spinning Top has smaller wicks and a more compact look, reflecting a balanced tug-of-war with less intensity.
The difference becomes clearer when you think about how they behave in the market. A High Wave pattern forms after a sharp move and signals that momentum is being challenged. Traders see this as a sign that the trend might be losing momentum, and they look to the next candle for confirmation.
A Spinning Top, appears in slower markets or consolidations and is more about low conviction than strong opposition. It still represents indecision, but not the kind that comes from a clash between strong buyers and strong sellers. Instead, it tells you that the market has paused and needs a new reason to move. Both candlestick patterns are useful, but they send very different messages based on the conditions around them.
| Section | High Wave | Spinning Top |
|---|---|---|
| Construction | A one-candle pattern with a small body and long wicks on both ends, showing that the price was pulled strongly in both directions before closing near the middle. | A single candle with a small body and shorter wicks, suggesting low conviction from either side and a relatively quiet trading period. |
| Forecast | Suggests that control is being contested with force, and a strong move is likely to follow once the market picks a direction. Confirmation from the next candle is required. | Suggests the market is pausing due to a lack of clear direction. On its own, it is not a strong trading signal but can be useful when paired with other tools. |
| Type of Pattern | A one-candle hesitation pattern | One-candle neutral pattern |
| Trend Prior to Pattern | Appears after a fast, aggressive move either up or down. It shows that momentum may be overextended and running out of fuel. | Appears in sideways markets or after small, quiet moves. It reflects uncertainty. |
| Best Use Case | Best used at the end of strong trends or volatile moves, just before the price snaps back or consolidates. | Works best inside ranges or consolidation zones when paired with support or resistance levels. Confirmation tools are needed to give it meaning. |
What Are The Limitations Of The High Wave?
The High Wave candlestick may look like a good signal on a chart, but it carries serious limitations that make it risky when used on its own. Its structure tells you that both buyers and sellers were active, yet neither side came out in control, which makes the signal completely dependent on the next candle. Because of this, it never gives a clear forecast and becomes easy to misread.
Another issue is that this pattern shows up often in meaningless spots, which can mislead you into believing a reversal or breakout is coming when nothing significant is developing. Its reliability depends entirely on context, and even then, it still needs confirmation from price or indicators before you can take action. Here are the main limitations of using the High Wave:
- Appears frequently in random areas where it holds no real meaning
- Offers no clear directional bias without a strong confirmation candle
- Can mislead beginners into taking trades based on indecision alone
- Fails to work well in low-volume or slow-moving markets
- Requires strong context from previous price action to be useful
- Often gets mistaken as a reversal signal when it’s just a pause
- Adds noise to the chart when used without proper filters or tools
Learn Pattern Trading With the WR Trading Mentoring
Pattern recognition means nothing unless you know how to apply it when trading in live markets.WR Trading’s mentoring does not just teach you to spot patterns like the High Wave on a chart, it shows you how to turn them into profitable positions.
The mentoring is not about memorizing where patterns should go, it’s about developing real-time decision-making using the full context of price movement. You are shown exactly how to build discipline around waiting, confirming, and executing only when the odds are in your favor.
Everything is centered around teaching you how the price actually behaves in different phases of a trend. You learn to work with live conditions and understand the difference between clean setups and false signals. More importantly, you are taught how to think like a trader, which means understanding risk, timing, and the flow of momentum.
(Learn To Trade And Read Candlestick Patterns Like A Pro)
Conclusion: The High Wave Pattern Shows Indecision At Critical Price Points
The High Wave candlestick pattern offers one of the clearest visual signals that the market has paused. Its narrow body and extended wicks capture a moment when momentum has broken down and both sides are testing each other without a clear winner. This pause does not predict what comes next, but it alerts traders to prepare for a shift in sentiment that can be confirmed on the following candle.
You’ve now seen how the High Wave fits into real chart conditions, what signals to wait for before acting, and how to avoid treating it as a signal by itself. The tools, setups, and comparisons throughout this guide were built to help you read market hesitation the right way and turn it into a structured, confident trade decision.
FAQ: Frequently Asked Questions on High Wave Candlestick Patterns
Is the High Wave pattern bullish or bearish?
The High Wave is neutral and does not lean in either direction without context. What comes before and after the candle decides if it turns into a bullish or bearish signal. Always wait for confirmation before taking a position.
Can I trade the High Wave pattern on its own?
No, the High Wave is never enough to trade by itself. It always needs a confirmation candle and other supporting tools like RSI or MACD. Without those, the signal has no real edge and you are more than likely to enter a losing trade.
Does the color of the High Wave candle matter?
No, the color gives you a slight clue, but it is not enough to trade on. A green High Wave may suggest buyers pushed harder, while red shows sellers had more power. The candle that comes next always confirms where the trend is likely to go.
Does Candle Size Matter in the High Wave Pattern?
Yes, the candle should have a small body with long wicks on both ends. If the body is too large or the wicks are too short, it no longer fits the pattern. Proportions matter because they tell you how uncertain the market really was.
Can You Use High Wave Candles for Exit Timing?
Yes, if you are already in a trade and see one form near resistance or support, it signals that the market is stalling, which may be a good time to reduce your position or tighten your stop. This is one of the pattern’s best uses.