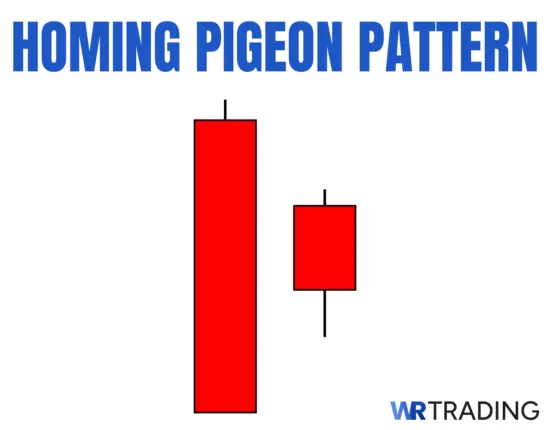
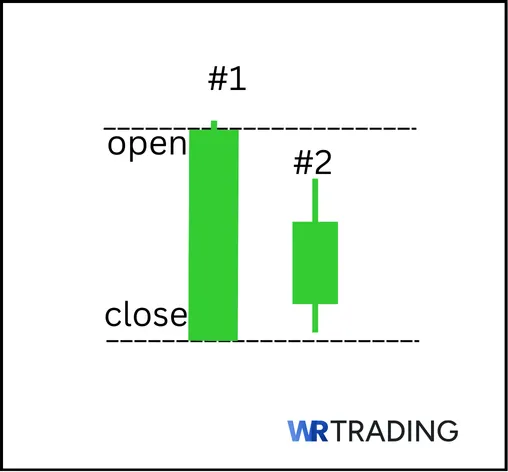
The Homing Pigeon candlestick pattern is a two-candle formation that signals a pause or reversal during a downtrend. It consists of two red candles, with the second candle forming within the body of the first candle. The first candle is large and bearish, showing strong selling pressure. The second candle opens and closes within the first, and is smaller in size, indicating a change in momentum as sellers lose strength.
The pattern shows hesitation and although the trend is still technically bearish, the lack of follow-through on the second candle suggests that bears are likely running out of selling pressure. The market is no longer accelerating downward, and buyers may be preparing to take control.
Traders use the Homing Pigeon pattern to anticipate reversals near support zones when paired with confirmation tools like bullish candles, rising volume, or moving average crossovers. It’s used to time entries when a trader wants to catch the early stages of a trend shift but still prefers to wait for a sign of weakening selling before acting.
The Home Pigeon is often used pattern due to its simple two-candle structure which makes it easy to spot on the chart. Furthermore the pattern gives an early signal that selling pressure is weakening. Additionally it combines well with confirmation tools for better timing.
We’ll walk through how this pattern forms, where it works best, and how to trade it correctly. In our experience, the Homing Pigeon is worth taking the time to study and adding it to your trading strategy due to the reliable signal it provides.
Key Facts of The Homing Pigeon Candlestick Pattern:
- Type of Pattern: Bullish reversal.
- Construction Characteristics:
- Candle 1: A large red candle showing strong bearish control.
- Candle 2: A smaller red candle that opens and closes within the body of the first, showing hesitation or slowdown in the selling momentum.
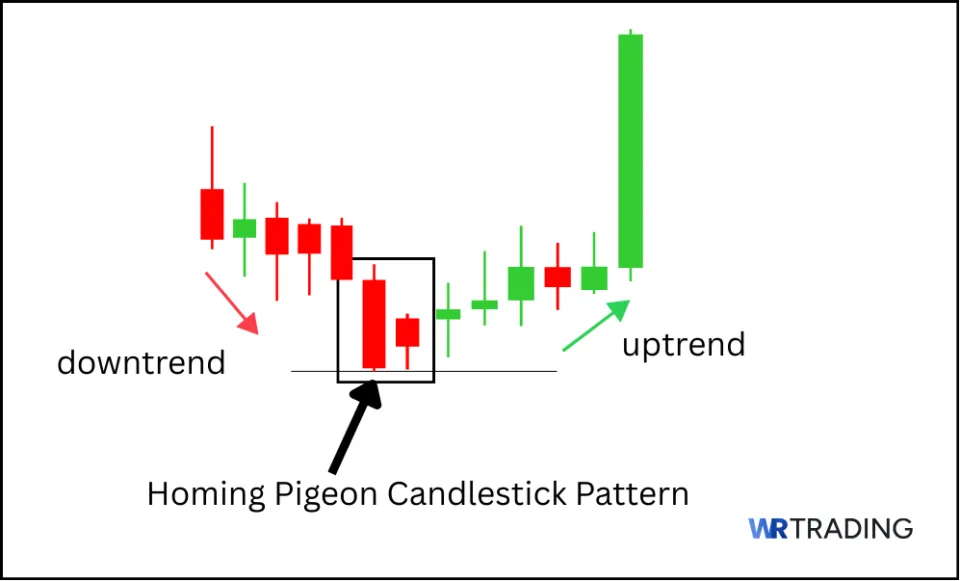
- Trend Prior to Pattern: The Homing Pigeon forms during a sustained downward trend, ideally after several consecutive red candles, where sellers have clearly been in control.
- Trade Forecast: The pattern signals a bullish reversal or temporary pause in the trend.
- Interpretation: The smaller second candle represents a slowdown in the pace of selling. Buyers have not yet taken full control, but the lack of new lows suggests a possible bottom forming.
- Stop-Loss Placement: A stop loss is placed just below the low of the first candle to protect against continued downward movement in case the reversal fails.
- Opposite Pattern: Descending Hawk.
- Success Rate: Between 54% and 66%
(Learn To Trade And Read Candlestick Patterns Like A Pro)
How Does a Homing Pigeon Candlestick Pattern Form?
The Homing Pigeon forms over two consecutive candles in a downward market. It requires a clear downtrend in place with visible selling strength in the candles before the pattern. The first candle in the sequence must be red with a wide body, showing that sellers were still in control. The second candle opens and closes within the body of the first, but it’s also red and smaller, which signals hesitation or slowing bearish momentum.

You’ll find this pattern after three or more consecutive red candles, often near swing lows or previous support levels. It shows that although sellers are still present, their influence is shrinking.
The market needs only two bars to create this pattern, and it can appear on any timeframe. However, it’s most relevant on daily charts or higher intraday periods like 1-hour or 4-hour charts since smaller timeframes produce less reliable signals.
Is The Homing Pigeon Candlestick Pattern Bullish Or Bearish?
The Homing Pigeon is a bullish pattern because even though both candles are red, the price action behind them points to a slowdown in bearish momentum. The second red candle’s inability to break lower or even match the size of the first red bar shows that the sellers are running out of strength, which is likely leading to a bullish reversal.
What Does the Homing Pigeon Candlestick Pattern Mean?
The Homing Pigeon pattern signals that bearish momentum may be stalling and a bullish reversal is developing. Sellers were clearly in control of the first red candle, but the second red candle failed to continue the move with the same intensity. This change in rhythm shows that bearish pressure is starting to fade. Buyers have not taken over yet, but they are no longer being overwhelmed.
From a psychological perspective, it reflects hesitation and sellers who were once confident now begin to see resistance, while buyers become more willing to step in. This results in a smaller red candle tucked inside a bigger red candle, setting up for a possible reversal. The meaning of the Homing Pigeon pattern becomes stronger when followed by a bullish green candle that breaks above the range of both red candles.
Where does the name of the Pattern Homing Pigeon Come From?
The Homing Pigeon candlestick pattern is named after the pigeon bird, known for returning to its home location across long distances. The name reflects the idea of the market returning toward a bullish direction after being pushed down in a bearish trend. Just as the pigeon finds its way back, this pattern signals that price action may begin to retrace or reverse back upward from a decline.
(Learn To Trade And Read Candlestick Patterns Like A Pro)
How to Identify a Homing Pigeon Candle in the Chart?
To identify the Homing Pigeon candlestick pattern start by scanning for a clear downtrend with multiple red candles. The pattern is only relevant in this context, where the price has been falling and shows signs of fatigue. Once you find a strong red candle, look immediately at the next one. It should also be red but smaller, and its open and close must fall inside the body of the previous candle.
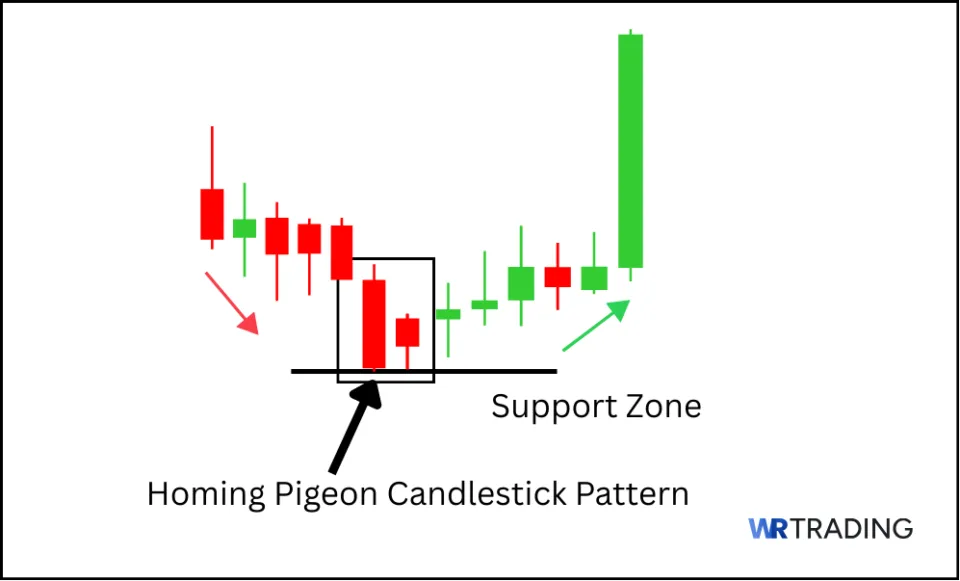
The Homing Pigeon pattern in most charts forms near support zones, prior lows, or after a sharp move down. It stands out because the second candle feels compressed or restricted. This internal structure is what separates it from other two-bar setups like the Inside Bar or Harami. Identifying it requires chart knowledge, but once you see the alignment of both candles and the trend context, it becomes a clear visual signal.
How to Trade the Homing Pigeon Candlestick Pattern
The Homing Pigeon is a pattern that can offer reliable reversal opportunities when combined with confirmation tools and proper risk management. Trading it correctly means understanding the conditions under which it forms and knowing how to place entries, stops, and exits without relying on guesswork or signals taken out of context.
Our quick guide below covers the full approach to using this pattern in live markets, from identifying setups to locking in profits at the right moment. Note that using chart structure, technical tools, and trade discipline will give you a more consistent outcome. Here’s the full step-by-step process.
- Find the Right Homing Pigeon Candlestick Pattern Setup
- Wait for the Appearance of the Homing Pigeon Candle
- Open Your Trade – Entry Point
- Wait For A Confirmation Or Not
- Choose Your Trading Take Profit
1. Find the Right Homing Pigeon Candlestick Pattern Setup
The first step is to make sure the pattern is forming in the right part of the chart. You want to see the Homing Pigeon forming during a clear downtrend or after a significant decline, ideally near a level where buyers have stepped in before. Look for clean price action with no heavy consolidation nearby, as this helps isolate the signal and reduces noise.
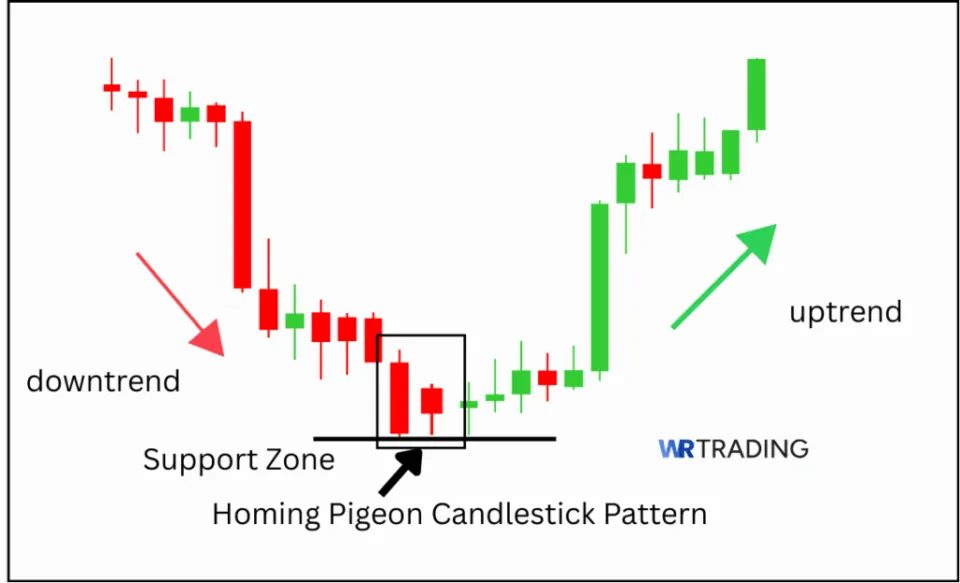
Ideal setups occur when the price reaches a key support zone, a Fibonacci level, or a prior swing low. When the first red candle is large and bearish, and the second red candle closes entirely inside it, you may have an early signal. Make sure the overall trend is clearly moving downward before the pattern shows up, as this pattern works best when there’s a strong move to reverse.
Best market conditions for the Homing Pigeon:
- At horizontal support levels where the price has bounced in the past
- On daily charts after a string of red candles that show heavy selling
- Near oversold RSI readings or near the lower Bollinger Band
- After a news-based selloff when volatility starts to reduce
- During high-volume declines that begin to slow on the second candle
2. Wait for the Appearance of the Homing Pigeon Candle
Once you are monitoring the correct price zone, you will need to watch closely for the two red candles that make up the pattern. The first candle must be a large red body that closes near its low, showing that bears were still in control before the signal. It’s important that this candle forms in the direction of the current trend because you want to see strong bearish energy leading into the pattern as that adds credibility to the potential reversal.
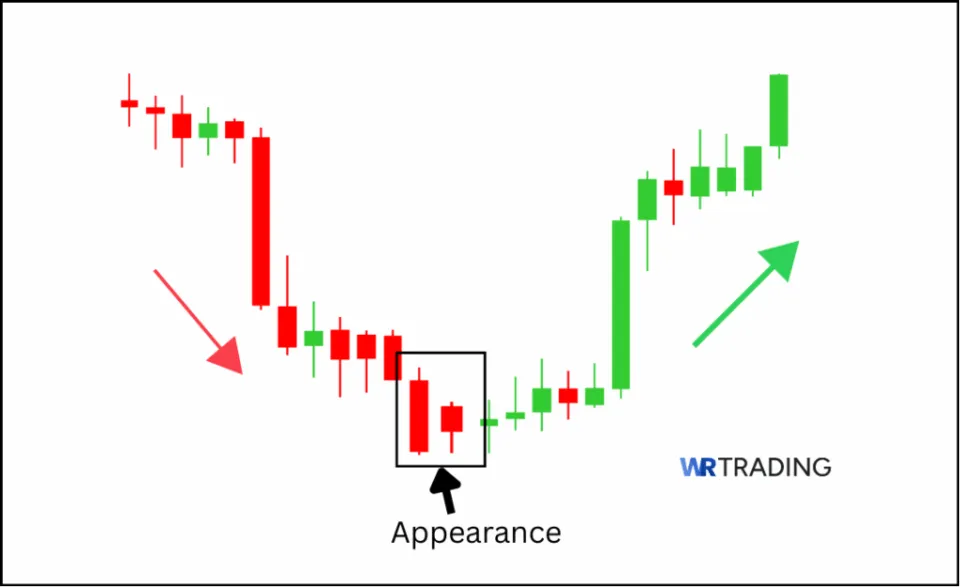
The second candle is smaller and also red, but it should form completely inside the body of the first red candle. It shows that the price failed to make a new low and the close was higher than the previous one.
That lack of follow-through is where the signal comes from as it represents a shift in pressure, with sellers losing conviction and buyers beginning to test the downside. Wait for this structure to appear clearly and avoid setups that are distorted by gaps, long wicks, or poorly defined bodies.
(Learn To Trade And Read Candlestick Patterns Like A Pro)
3. Open Your Trade – Entry Point
Once the Homing Pigeon pattern is completed, your focus should shift to executing the trade with a clear entry and stop-loss plan. The most common entry is just above the high of the second candle. This gives you a cleaner entry that only activates if the price begins to push upward.
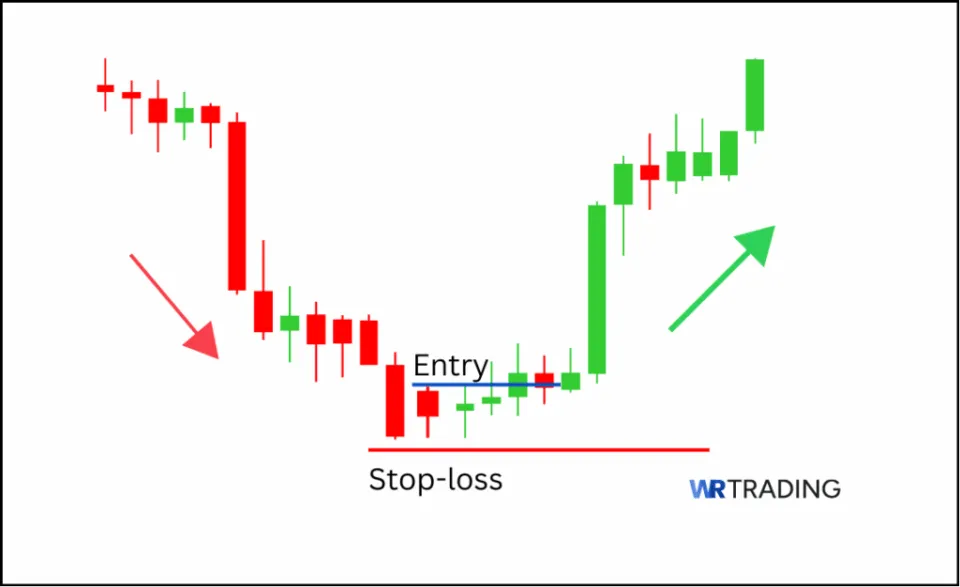
Another method is entering immediately at the open of the next candle after the pattern completes. This option suits those who want to catch the move early when the setup shows strong structure and aligns with other tools like support zones or rising volume.
Stop-loss placement should sit below the lowest point of the pattern, which is often the low of the first red candle. This protects your position in case the market fails to hold the setup. Also, you can use nearby support levels as a reference for your stop, as long as the distance still allows for a healthy risk to reward.
4. Wait For A Confirmation Or Not
There are two ways to approach the Homing Pigeon pattern: with confirmation or without. Traders who prefer more safety wait for the next candle to close above the high of the second candle. That kind of move shows buyers are beginning to take control and confirms the hesitation signal given by the Homing Pigeon. You can also look for added signs such as increased volume, bullish crossovers on indicators, or a candle that breaks a recent short-term resistance.
Alternatively, you can choose to act immediately after the pattern forms. Entering without confirmation can give a better price, but it brings more risk if the move does not follow through. This approach may be used when other supporting factors are already in place, such as a strong support level, volume exhaustion on the prior move, or a bullish divergence.
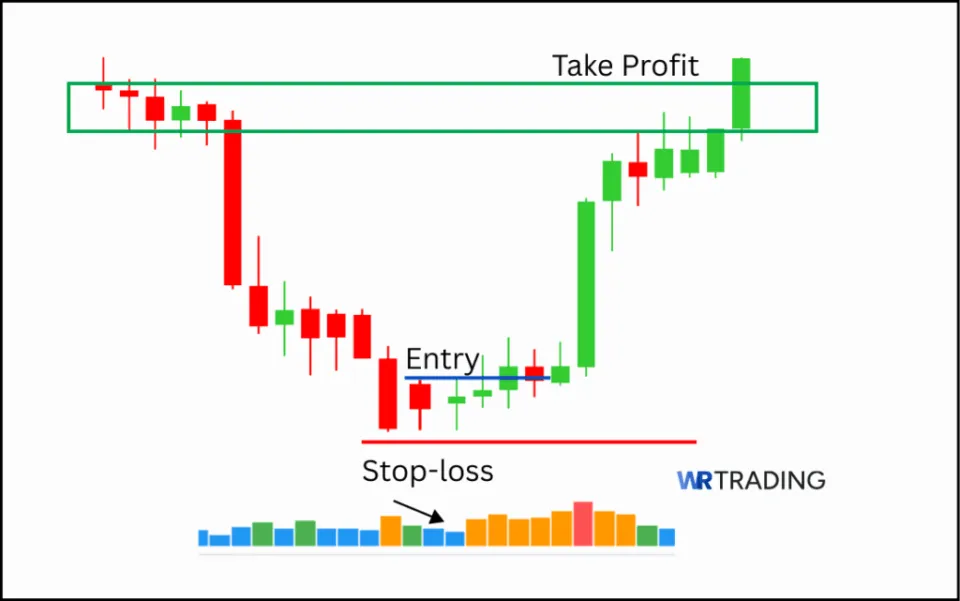
5. Choose Your Trading Take Profit
Once your entry and stop-loss are in place, the next step is deciding where to close the trade. Setting a take-profit level gives you a clear exit target and helps lock in gains without emotional interference. A common method is to aim for the next major resistance level that sits above the pattern. You can draw horizontal lines across previous swing highs, price clusters, or failed rallies that line up with your setup. These areas act as magnets for the price when momentum picks up.
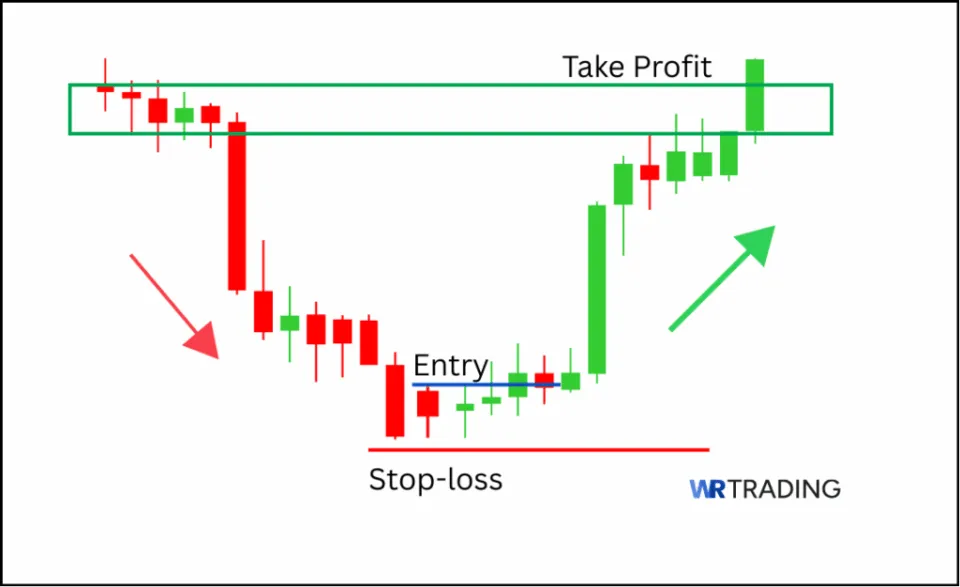
Another technique is to use a risk-to-reward ratio based on your stop loss distance. For example, if you risk 20 pips below the entry, aim for 40 to 60 pips above, depending on the strength of the trend and nearby structure.
Use tools like Fibonacci retracement or measured move projections from the pattern’s size. Volume analysis and trend strength indicators can also help decide whether to take full profit at a single point or scale out in parts. Your profit target should match your strategy and adapt to the price context, not just the pattern on its own.
(Learn To Trade And Read Candlestick Patterns Like A Pro)
Which Strategies Can Be Used For The Homing Pigeon Candlestick Pattern?
The Homing Pigeon pattern works best when it is part of a trading strategy rather than a standalone signal since its real value comes from confirming the downtrend may be slowing or reversing. Therefore, by combining the Homing Pigeon with additional tools, trades become more precise and allow for better control over entries and exits.
Each of the following strategies uses the Homing Pigeon as a key visual clue but layers in other elements to create more reliable trades.
- Volume-Based Confirmation Strategy
- RSI Reversal Strategy
- News-Based Pattern Reaction Strategy
1. Volume-Based Confirmation Strategy
Volume gives confirmation to the Homing Pigeon pattern by measuring the level of activity that occurs during the second red candle. When volume drops sharply on the second red candle, it signals that sellers are losing interest, which aligns with the idea that bearish momentum is fading.
A more reliable setup happens when volume is lower on the second candle but increases on the candle that follows the pattern, ideally if that candle closes green and significantly higher.
To trade this strategy, wait for the Homing Pigeon to form during a visible downtrend. Watch for declining volume during the pattern and a volume increase on a bullish follow-up candle. Enter long after the third candle breaks above the high of the second, with a stop-loss placed just below the low of the first candle.
2. RSI Reversal Strategy
Using the Relative Strength Index (RSI) can strengthen Homing Pigeon patterns by helping confirm that the market is oversold. When RSI is under 30 during a downtrend and a Homing Pigeon appears, the odds of a short-term reversal increase. The RSI does not need to reverse immediately, but if it flattens or begins turning upward as the pattern completes, that is a sign that bearish pressure is fading.
Scan for Homing Pigeon patterns in markets where RSI is below 30 or has just crossed upward. Wait for a green candle to close above the high of the second red candle in the pattern. That candle becomes your entry trigger. Place the stop-loss just under the low of the first red candle, and consider taking partial profits if RSI crosses 50 on the way up.
3. News-Based Pattern Reaction Strategy
Major news or fundamental events can cause sharp drops in price followed by fast recoveries, creating ideal conditions for a Homing Pigeon. If bad news causes a strong bearish candle, but follow-through selling fails to appear and a Homing Pigeon forms, it shows the market may be absorbing the shock and preparing to recover. This is more common in stocks or crypto assets with high sentiment exposure.
In this strategy, monitor reaction candles that form after significant news drops. When the initial reaction creates a large red candle, look for a smaller red candle to follow within the body of the first. This signals market hesitation. Wait for a bullish candle to close above the second red candle’s high, then enter long with a stop under the first candle’s low. Pairing this with a news calendar and high-volume confirmation helps filter noise and improve trade accuracy.
What Is The Success Rate Of The Homing Pigeon Candlestick Pattern?
In our experience, the Homing Pigeon has shown a success rate between 54% and 66% when used in the right context. It works more consistently when paired with tools like support zones, rising volume, and momentum indicators such as RSI or MACD.
We found that the pattern performs best on the daily timeframe and when it appears near well-defined areas of previous demand. Entries based solely on the two-candle structure without confirmation were far less effective. This is why it is always better to combine it with confirmation tools and clear trade setups, rather than treating it as a guaranteed reversal signal on its own.
Is the Homing Pigeon Candlestick Pattern Suitable For Beginners?
Yes, the Homing Pigeon is beginner-friendly due to its simple two-candle construction and visual signal when forming during a clear downtrend. It does not rely on complex conditions or advanced tools, which allows new traders to spot it without needing extensive technical experience.
That said, the pattern is most useful when combined with basic support and resistance zones or simple indicators like moving averages. Beginners should avoid treating it as a standalone signal and instead use it as a sign of weakness in a bearish trend, waiting for further confirmation before entering a position.
(Learn To Trade And Read Candlestick Patterns Like A Pro)
What Are the Pros and Cons of Trading the Homing Pigeon Candle Pattern?
The Homing Pigeon pattern provides a clean, structured trade setup that many traders find useful in identifying a slowdown in bearish momentum. It shows up in situations where the downtrend has begun to lose momentum, giving an early heads-up that the trend may be switching. The two-candle structure makes it easier to spot on the chart, and when paired with volume confirmation or trendline support, it becomes more reliable.
Nevertheless, there are limitations to consider, like in markets with high volatility or poor trend structure, the Homing Pigeon often gets lost in the noise. Without confirmation from the next candle or a technical indicator, the signal alone can be misleading. Its performance also tends to vary depending on the timeframe, which means backtesting is important before trusting it in any new market.
Here are the main pros and cons of the Homing Pigeon candlestick pattern:
Pros
- Clear Signal of Weakening Bearish Momentum
- Visually Recognizable Structure
- Works Well With Confirmation Tools
- Naturally Occurs Near Support Areas
- Effective in Fast Markets
Cons
- Loses Strength Without Trend Context
- Can Be Mistaken for Inside Bar Formations
- Performance Varies Across Timeframes
- Confirmation Required for Better Accuracy
- Limited Effectiveness in High-Volatility Conditions
What Are The Advantages Of The Homing Pigeon Pattern?
The Homing Pigeon offers advantages for traders who understand how to spot subtle shifts in selling pressure. The pattern is valuable because it signals hesitation without needing an immediate reversal candle, giving traders time to prepare.
It pairs well with tools like support zones, rising volume, or moving average crossovers, allowing for clear risk placement and reliable confirmation. These strengths make it a dependable addition to a broader trading strategy when used with proper context. Here are the main pros of the Homing Pigeon:
- Clear Signal of Weakening Bearish Momentum: The second red candle forming entirely within the body of the first red candle signals that sellers are struggling to push the price lower. It shows a shift in market energy and suggests that downside pressure is stalling. This pause can be the earliest warning that a reversal may follow.
- Visually Recognizable Structure: The two-candle structure of the Homing Pigeon is simple to identify on the chart. It stands out due to the size contrast between the large first candle and the smaller second one. This makes it easy for real-time scanning and fast decision-making.
- Works Well With Confirmation Tools: Traders can improve the pattern’s effectiveness by pairing it with moving averages, volume changes, or reversal indicators. When used in conjunction with those tools, the Homing Pigeon becomes more reliable and easier to act on. It gives a more complete picture rather than relying on candle structure alone.
- Naturally Occurs Near Support Areas: The Homing Pigeon often forms near support levels, where traders are already looking for signs of a bounce. When the pattern appears in those zones, it strengthens the case for a reversal trade. This gives the trader a clear reason to take a long position based on structure and price behavior.
- Effective in Fast Markets: The Homing Pigeon works well during sharp downtrends when traders are watching for oversold bounce opportunities. Its ability to catch the early shift in sentiment helps position the trade just as momentum begins to change. This gives a time advantage compared to waiting for slower indicators.
What Are The Disadvantages Of The Homing Pigeon Pattern?
Despite the Homing Pigeons benefits, it has several weaknesses that can lead to poor trades if ignored. It does not work well in sideways markets or during periods of low volume, where its meaning can be unclear.
Also, its structure is sometimes confused with other patterns that do not suggest the same reversal intent. These issues highlight why this pattern should always be combined with trend context and supporting evidence before acting. These are the main cons of the Homing Pigeon:
- Loses Strength Without Trend Context: If the Homing Pigeon forms during sideways or choppy price action, it lacks the trend momentum needed to create a bullish reversal. The signal is meant to show a slowdown in a strong downtrend, not a random pause. Without a clear bearish trend, the candles may give misleading signals.
- Can Be Mistaken for Inside Bar Formations: The structure of the Homing Pigeon is similar to inside bars, which also indicates consolidation. This can create confusion for traders who rely solely on visual cues. Misidentifying the setup could lead to taking trades that lack the reversal strength expected.
- Performance Varies Across Timeframes: The pattern may work well on higher timeframes like the daily or 4-hour charts but may give weaker results on the 1-minute or 5-minute chart. Its effectiveness is not consistent across all styles of trading and backtesting is needed to determine where it fits your approach best.
- Confirmation Required for Better Accuracy: The Homing Pigeon is not strong enough to act on without further signals. It almost always requires volume spikes, bullish follow-through, or trendline breaks to validate the reversal. Acting on the pattern without confirmation can increase your exposure to failed setups.
- Limited Effectiveness in High-Volatility Conditions: During sharp corrections or reactionary market phases, the Homing Pigeon forms inside chaotic price action. Although the candle bodies may meet the criteria, the surrounding movement creates less trust in the signal. The price may continue to whipsaw instead of settling into a clean trend shift.
Can the Homing Pigeon Pattern Fail?
Yes, the Homing Pigeon pattern can still fail in several market conditions. Knowing these failure signals helps you avoid poor entries and spot situations where the setup looks valid on the surface but lacks conviction. These are some possible reasons this pattern may not lead to a bullish continuation.
- Lack of Trend Context: When the Homing Pigeon forms outside of a clear downtrend, its message becomes diluted. Without an established bearish leg leading into the pattern, the second red candle does not carry the same weight. It may simply reflect short-term noise rather than a meaningful shift in momentum.
- Bearish Continuation After the Second Candle: Even though the second red candle closes within the first, a strong bearish red candle that follows immediately can erase the signal. When the price breaks below the pattern low with volume, it confirms that sellers are still in control. This invalidates the setup and leads to further downside.
- Low Volume During the Pattern: When both red candles form on decreasing or flat volume, it suggests that the slowdown is more about market exhaustion than true buying interest. Without new demand stepping in, the reversal becomes unlikely to stay.
- Forming During a Consolidation Zone: The Homing Pigeon loses significance if it appears in a tight consolidation or choppy range. In these situations, the pattern may look technically correct but carries little predictive value. The market is indecisive, and neither buyers or sellers are truly in control.
- Second Candle Has a Strong Upper Wick: When the second red candle closes within the first but leaves a long upper wick, it signals potential rejection from higher prices. That means buyers pushed up briefly, only to be overwhelmed by sellers before the close. This weakens the bullish interpretation of the pattern.
- Too Small to Matter: If both red candles are unusually small or form within a tight price range, the signal becomes less meaningful. A strong Homing Pigeon should show contrast between the strength of the first candle and the hesitation of the second.
- Appears Near Resistance Instead of Support: This pattern’s signal is stronger when it forms near strong support zones. If it shows up near a resistance level, it may act as a trap, pulling in buyers before reversing sharply. Always consider the larger price structure before entering.
(Learn To Trade And Read Candlestick Patterns Like A Pro)
Which Indicators Can Be Combined With The Homing Pigeon Pattern?
The Homing Pigeon pattern becomes more useful when it’s paired with technical indicators that confirm trend exhaustion or signal a potential reversal. These tools help add structure to your trades by providing timing cues, filtering false signals, and offering better entry and exit points. Here are a few effective indicators that can be combined with the Homing Pigeon pattern, along with the best way to use them in context.
- Relative Strength Index (RSI): RSI works well when used to detect oversold conditions leading into the Homing Pigeon pattern. A reading below 30 signals that bearish momentum is stretched, and the pattern may be hinting at a turning point. Look for an RSI reversal or a bullish divergence to increase confidence in the signal.
- Moving Average Convergence Divergence (MACD): MACD can help confirm a shift in trend when the Homing Pigeon appears during a downtrend. A bullish crossover of the MACD line and the signal line after the pattern shows that momentum is changing. Using this indicator with the pattern adds clarity when judging the strength of a reversal attempt.
- Volume Profile or On-Balance-Volume (OBV): Volume-based indicators show if real interest is building around the pattern. If the Homing Pigeon forms and is followed by rising OBV or strong buying volume, the move has better odds of continuation. Low or flat volume reduces the quality of the signal.
- Exponential Moving Averages (20 EMA and 50 EMA): These moving averages can provide visual trend context and act as dynamic support or resistance. If the Homing Pigeon forms near the 50 EMA and the price holds above it, the setup becomes more trustworthy. A crossover of the 20 EMA above the 50 EMA following the pattern can also act as confirmation.
What Are Similar Patterns To The Homing Pigeon Pattern?
The Homing Pigeon pattern is part of a group of two-candle formations that highlight weakening momentum or potential reversal signals during downtrends. Some of these patterns involve smaller second candles inside a dominant first candle, while others show slowing momentum and buying interest near support.
In the table, you can check out some of the similar patterns that you may want to learn and incorporate into your trading strategy alongside the Homing Pigeon. Each one reflects a unique structure, but all of them can help traders identify potential turning points when used in the right context.
| Pattern Name | Key Characteristic | Best Use Case |
|---|---|---|
| Inside Bar | The second candle is entirely inside the range of the first. | Used to prepare for breakout setups after strong trends. |
| Bullish Harami | The small green candle inside a prior large red candle. | Signals possible bullish reversal in downtrends. |
| Tweezer Bottom | Two candles with matching lows, showing rejection of a level. | Found at support zones to mark early reversal signals. |
| Engulfing Bullish | A large green candle fully engulfs the red candle before it. | Used to confirm momentum shift at the bottom. |
| Piercing Line | A red candle followed by a green candle that closes more than halfway up. | Indicates buyers stepping in after bearish pressure. |
Learn more about Candlestick Patterns by downloading our free Candlestick Cheat Sheet here!
What Is The Opposite Pattern Of The Homing Pigeon?
The opposite of the Homing Pigeon is the Descending Hawk pattern. It’s identical to the Homing Pigeon but forms in a bullish trend with green candles. Both patterns are built from two candles, and in each formation, the second candle fits inside the first. The difference is the Descending Hawk is a bearish reversal indicating a switch from buying pressure to selling.
| Section | Homing Pigeon | Descending Hawk |
|---|---|---|
| Construction | Candle 1: Large red body showing strong selling. Candle 2: Smaller red body entirely within the first candle’s range. | Candle 1: Large green body showing strong buying pressure. Candle 2: Smaller green body that remains within the first candle’s range. |
| Forecast | Shows that the bearish trend is slowing, and buyers may soon gain control. | Indicates that bullish momentum is weakening, opening up to a potential reversal. |
| Type of Pattern | A two-candle bullish reversal pattern. | A two-candle bearish reversal pattern. |
| Trend Prior to the Pattern | Formed after sustained downward price action, during an active bearish trend. | Found after a strong bullish move, often at or near resistance or the top of an extended rally. |
| Best Use Case | Works well near support zones where the market shows signs of bottoming out. | Effective when the price reaches overextended levels and begins to stall, often near resistance. |
What Are The Limitations Of The Homing Pigeon?
The Homing Pigeon pattern can offer a helpful signal in certain conditions, but it comes with clear limitations that traders need to recognize before relying on it. The structure alone is not enough to act upon and without chart context, proper validation tools, or supporting trend strength, the signal can lead to weak entries or false assumptions.
Here’s a quick look at where the Homing Pigeon is limited:
- Loses its signal in sideways or range-bound markets.
- Offers no direct entry trigger without confirmation.
- Can form frequently in choppy price action with no real impact.
- Easy to overlook due to its subtle two-candle structure.
- Requires volume or indicator support to validate the signal.
- Can be mistaken for other inside bar patterns.
- Performs poorly on very short timeframes.
Learn Pattern Trading With the WR Trading Mentoring
Learning a pattern like the Homing Pigeon seems simple at first but to actually be consistently profitable you need to understand when it matters, how to confirm it, and how to fit it into a wider trading plan. That’s exactly what our WR Trading Mentoring is designed to teach. You learn how to approach the market with structure by combining candlestick patterns, technical tools, and risk control.
Inside the mentoring, we cover the Homing Pigeon pattern as part of a broader strategy focused on real trading decisions. You will work through chart examples, see when the pattern works best, and learn how to handle false signals or unclear setups. The goal is to move beyond random entries and give you a reliable process to follow in live conditions.
(Learn To Trade And Read Candlestick Patterns Like A Pro)
Conclusion: The Homing Pigeon Is a Reliable Pattern for Catching Early Reversals
The Homing Pigeon candlestick pattern offers an easy-to-spot signal to catch potential reversals during a downtrend. In our experience, it works best when used with confirmation tools like volume analysis, RSI, or moving averages near support levels. Also, it performs well on higher timeframes when the broader trend is clearly defined.
However, the Homing Pigeon is not ideal to use in isolation or in fast-moving markets without context since you’re likely to enter losing trades. When combined with strong setups and proper stop placement, it becomes a great pattern for spotting early shifts in momentum. We’ve seen it deliver consistent results in slower conditions where traders want to enter reversals with more structure and less noise.
FAQ: Frequently Asked Questions on the Homing Pigeon Candlestick Pattern
Should You Use the Homing Pigeon on Higher Timeframes?
Yes, using the Homing Pigeon on daily or 4-hour charts can improve its reliability. Higher timeframes reduce the noise found in lower intervals and highlight more meaningful shifts in momentum. When the price respects support on larger charts, the Homing Pigeon can offer a stronger reversal signal.
Does the Homing Pigeon Pattern Need a Volume Spike to Work?
Not always, but volume does help confirm if the market is responding to the Homing Pigeon. A small second candle with rising volume can show that buyers are starting to engage even as the price remains within the previous range. When volume fades instead, the pattern loses reliability and follow-through becomes less likely.
How Do You Manage Risk When Trading the Homing Pigeon?
Risk is managed by placing the stop-loss below the low of the first red candle and calculating a favorable reward-to-risk ratio. The Homing Pigeon works best when there is room for the price to move upward after the pattern forms near key support. Avoid using it in consolidation zones where clean stop placements are harder to define.
Is the Homing Pigeon Pattern Useful in Trending Markets?
Yes, it works well in trending markets when the trend is pulling back and showing signs of exhaustion. The Homing Pigeon does not mark the trend’s start but offers a chance to catch the next leg once a short-term correction loses strength. When placed at the right moment, it aligns with trend continuation strategies.
Is It Better to Wait for a Bullish Candle After the Homing Pigeon Forms?
Yes, waiting for a confirming bullish candle increases the likelihood that the signal will work. It shows that buyers have actually stepped in and that the stall in bearish pressure is more than just a pause.