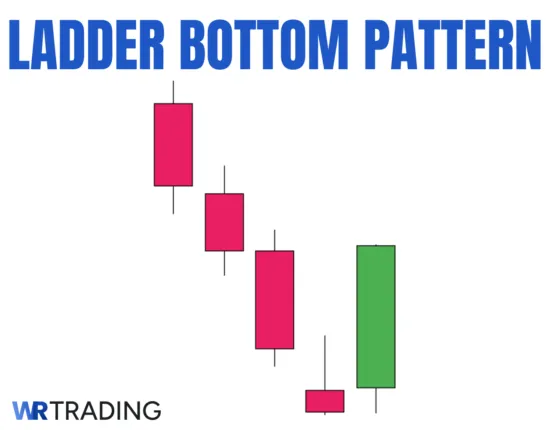
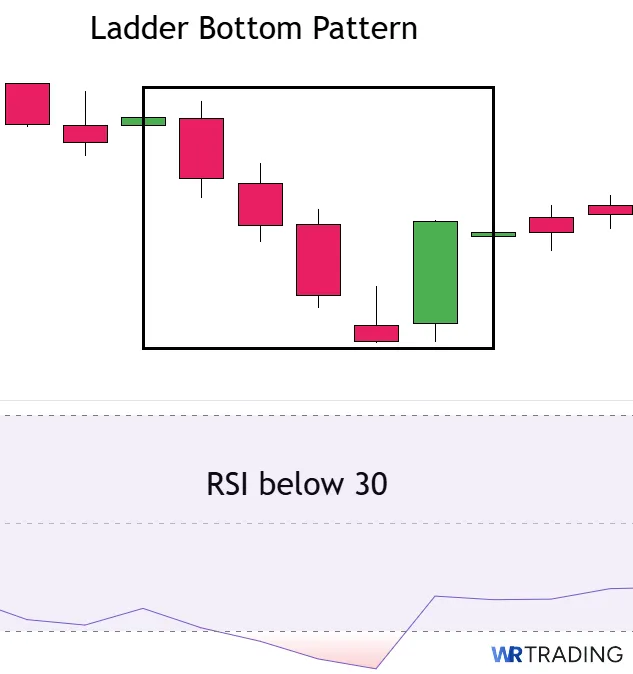
The Ladder Bottom is a five-candle bullish reversal pattern that starts with four red candles, each closing lower than the one before it, creating a ladder-like structure. The fourth candle forms a long upper wick, indicating buyers are starting to resist the bearish trend. The fifth candle is green and breaks above the body of the fourth red candle, closing higher and confirming the start of a bullish trend.
It forms during a downtrend and shows a gradual loss of bearish control before buyers step in with a strong reversal. Each candle contributes to a specific part of the trend shift, and the sequence matters in understanding the sentiment behind it.
Some of the pros of the Ladder Bottom candlestick pattern include: Clearly shows a loss of bearish momentum across five candles, offers a reliable bullish reversal signal, and it’s easy to spot once the fifth candle confirms the shift.
Traders watch for this pattern in declining markets where sentiment is already stretched to the downside. Once the fifth candle confirms the reversal with a strong close, the Ladder Bottom becomes a signal to start looking for long trades. In our experience, the Ladder Bottom is a highly reliable pattern that is worth adding to your trading strategy due to its high success rate of 72.4%.
Key Facts About The Ladder Bottom Candlestick Pattern:
- Type of Pattern: Bullish reversal.
- Construction Characteristics:
- Candle 1: Large red candle with strong close lower.
- Candle 2: Red candle that closes lower than the first.
- Candle 3: Another red candle continuing the trend.
- Candle 4: Red candle with a smaller body and a long upper wick, indicating weakening pressure.
- Candle 5: A green candle that opens within the previous body and closes above the fourth candle’s high.
- Trend Prior to Pattern: Forms during a sustained downtrend with persistent bearish momentum in the background.
- Trade Forecast: Suggests a reversal into upward momentum once the fifth candle completes the structure with a confirmed break above the fourth candle’s range.
- Interpretation: Signals the loss of control by sellers and the return of buyer strength, reflected through a clean five-candle sequence.
- Stop-Loss Placement: Placed below the lowest point within the five-candle formation to allow the trade room to move without cutting it prematurely.
- Opposite Pattern: The Ladder Top.
- Success Rate: 72.4% success rate.
(Learn To Trade And Read Candlestick Patterns Like A Pro)
How Is The Bullish Ladder Bottom Pattern Formed?
The Ladder Bottom pattern forms over five consecutive candles during a downward trend and signals a bullish reversal. It begins with three large red candles, each closing lower than the last, showing that sellers are in full control and bearish sentiment is dominating the market.
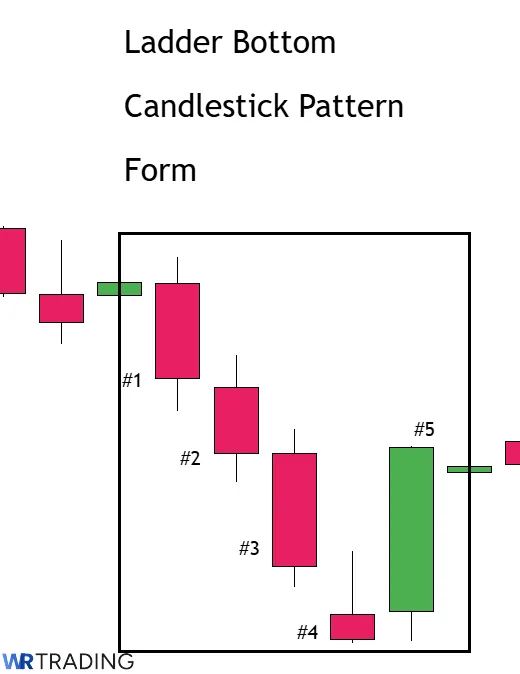
These three candles create the base of the ladder and are the exhaustion phase of selling. The fourth candle is red but shows a clear change in momentum, with a smaller body and a long upper wick. It can still close lower, but the pace of the decline has clearly slowed down.
The final and most important candle is a strong green candle that opens within the wick of the fourth red candle and closes above its high. This fifth candle indicates the turning point in market sentiment as buyers step in with stronger conviction, reacting to a support zone or oversold conditions.
The full pattern is most reliable on higher timeframes like the daily or 4-hour chart, where each candle represents a decent portion of market activity. Patterns forming on these timeframes carry more strength and are easier to confirm. After the Ladder Bottom completes, the following candles should continue the upward trend.
What Does the Ladder Bottom Candlestick Pattern Mean?
The Ladder Bottom pattern indicates a moment where selling pressure begins to break down and buyers start to test the market. It forms over five candles in a way that reveals the changing mindset on both sides. Sellers dominate the early part of the pattern, pushing the price lower with conviction through three consecutive red candles. Each close reinforces the downtrend and adds to the negative sentiment already present in the market.
The fourth candle signals the first disruption in that pattern. Although it still closes red, the long upper wick shows that buyers are no longer stepping aside. They begin to absorb the pressure and attempt to reverse the move, even if that effort is not yet fully successful. This candle leads to hesitation among sellers, who now see that the clean momentum they relied on is starting to fade.
The fifth candle changes the balance completely since it closes strong and green, moving above the high of the previous bar and confirming that buyers have taken over. That visual and psychological shift forces many sellers to exit their positions, while others wait for confirmation before accepting that control has changed. At the same time, buyers who were waiting for a clear entry now see the opportunity to step in with defined risk and growing confidence in a reversal.
Where does the name of the Pattern Ladder Bottom Come From?
The name Ladder Bottom comes from the visual structure created by the first four candles, where each red bar closes lower than the one before it. This descending formation resembles a ladder leaning downward, with each step reflecting another push from the sellers. The regular drop in price from one candle to the next gives the appearance of a ladder leading into the low point of the trend.
(Learn To Trade And Read Candlestick Patterns Like A Pro)
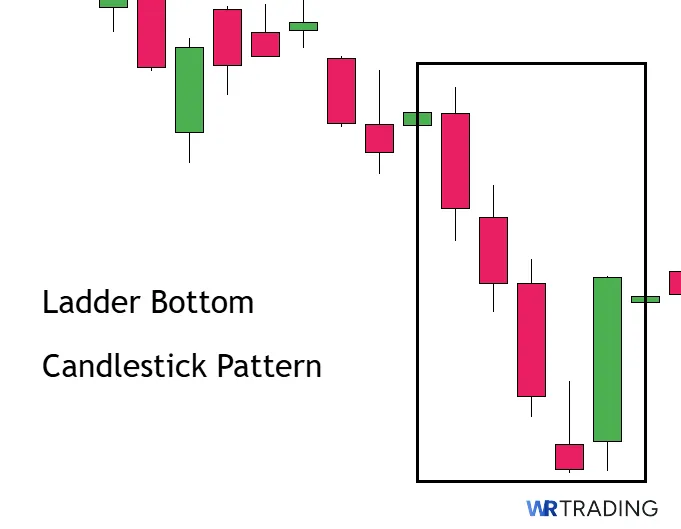
Example of the Ladder Bottom Pattern in the Chart
In the below section you will find a perfect Example of the Ladder Bottom Candlestick Pattern in the Apple Stock.
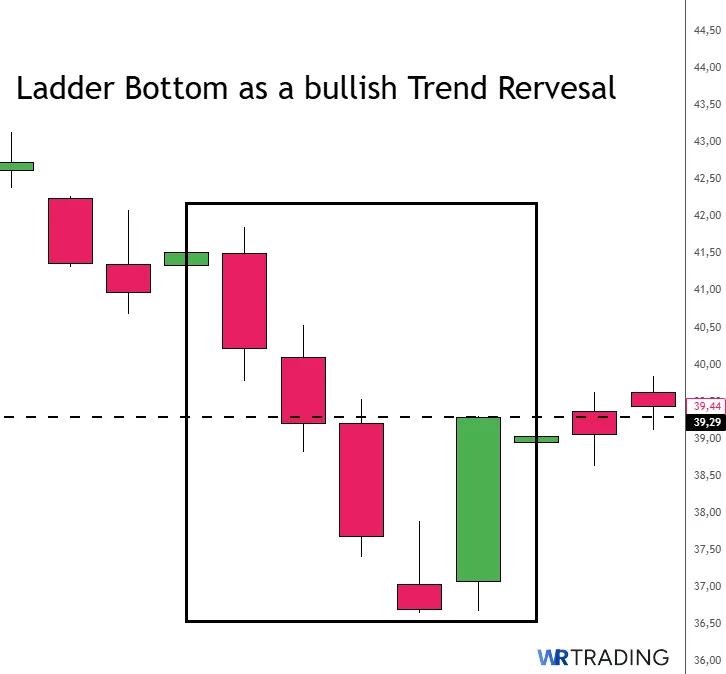
As you can see, there are three strong red candles. The fourth Candle shows a smaller Body and higher Wicks. The fith and last Candle shows bullish momentum and closes at 39.29 USD above the fourth Candle. The Reversal Pattern ist completed.
How to Identify a Ladder Bottom Candle in the Chart
To identify a Ladder Bottom, start by locating a steady and recognizable downtrend where the price action shows no signs of relief over several candlesticks. The first three candles in this pattern must be bearish, and each should progressively close lower than the previous one to reflect continuous selling pressure.
These candles are always red, and their structure tends to show minimal lower wicks, indicating that sellers dominated the candle’s formation from open to close with little interruption. The fourth candle is red too with a long upper wick, but its range may narrow slightly, showing early signs of weakening momentum as the selling becomes less aggressive.
The fifth candle is where the shift takes place and must be green to signal a clear change in sentiment. It should open within the previous candle’s body and close above its high, showing that buyers not only entered the market but managed to overpower the prior sellers.
Look for the entire five-candle sequence near support zones, oversold indicators, or trend exhaustion levels, as these locations strengthen the validity of the signal.
(Learn To Trade And Read Candlestick Patterns Like A Pro)
How to Trade the Ladder Bottom Candlestick Pattern:
Everything leading up to the Ladder Bottom pattern means little without a clear method for turning it into a trade. The pattern shows a potential reversal, but recognizing it on the chart is only one part of the process. Trading it effectively means understanding the conditions it forms in, waiting for the full structure to appear, and managing each stage of the trade with precision.
Here’s a quick step-by-step guide that covers:
- Find the Right Ladder Bottom Candlestick Pattern Setup
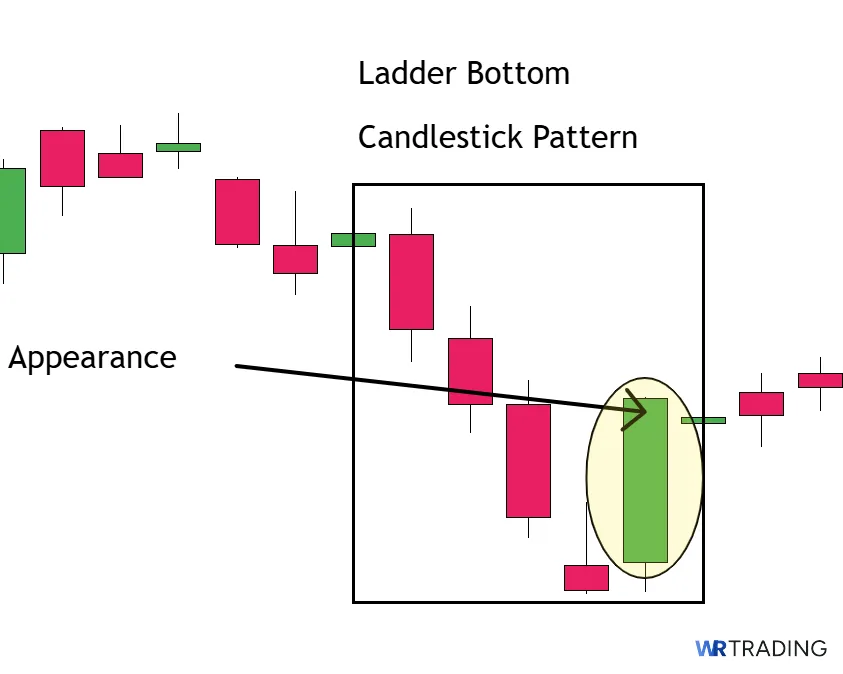
- Wait for the Appearance of the Ladder Bottom Candle
- Open Your Trade – Entry Point
- Wait For A Confirmation Or Not
- Choose Your Trading Take Profit
1. Find the Right Ladder Bottom Candlestick Pattern Setup
Start by looking for a clear downtrend because the Ladder Bottom pattern only works when it appears after sustained selling pressure. It should not appear in sideways or quiet conditions as the pattern will not provide a strong reversal signal. You want to see lower highs, lower lows, and momentum that has carried the market into oversold territory or into a known support area.
Use technical tools to help confirm the context:
- Support zones: Look for the pattern forming near previous swing lows or price levels that have held in the past.
- RSI below 30: This adds confirmation that the market is overstretched and may be due for a rebound.
- Volume analysis: Declining volume on the first three candles followed by a spike on the fifth can support the idea that momentum is reversing.
- Trend exhaustion tools: Moving averages, Bollinger Bands, or custom momentum indicators can all provide signals when selling has gone too far.
The more confirmation you have around the Ladder Bottom, the more meaningful the pattern becomes. You want the market to already be under pressure, but not in freefall. The goal is to find the point where bearish momentum is running out of pressure and conditions are setting up for a reversal.
2. Wait for the Appearance of the Ladder Bottom Candle
After identifying suitable Ladder Bottom conditions, allow the entire five-candle formation to complete. Don’t make the mistake of anticipating the signal after the fourth candle appears, but until the fifth candle confirms the reversal until then the pattern remains incomplete. The final green candle must close above the high of the fourth candle to validate the shift in sentiment. Anything less than that leaves the pattern open to failure or continuation of the downtrend.
Remember, the first three red candles must continue the decline with progressively lower closes. The fourth introduces a long upper wick with a smaller body, revealing early buyer activity. Then the fifth must follow through with a strong close above the fourth’s high. If that candle falls short or finishes with indecision, avoid trading the pattern.
3. Open Your Trade – Entry Point
Once the fifth candle completes with a decisive green close above the high of the fourth red candle, the reversal has taken form and the pattern is ready for an entry. Our approach is to open the trade shortly after the fifth candle closes, placing the entry as close to the upper portion of that candle’s range as possible.
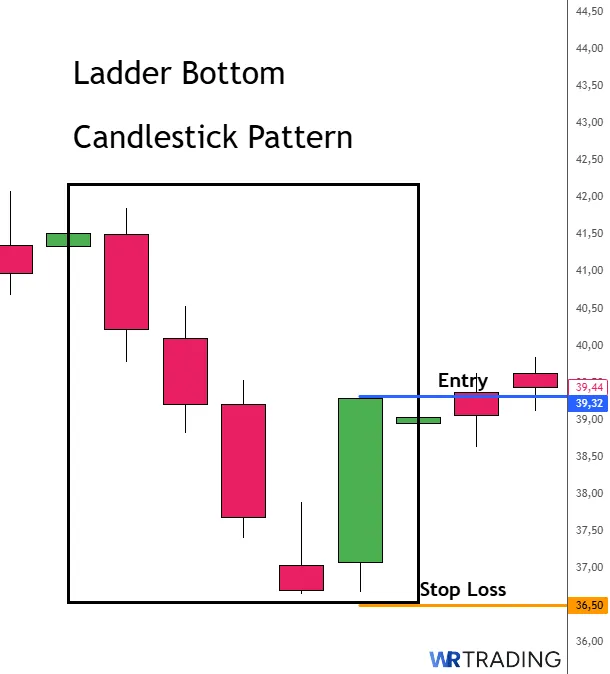
The stop-loss placement must be based on the full width of the pattern rather than any single candle because the low point within the five-candle sequence defines the area where buyers have decisively rejected lower prices. This method gives the market room to fluctuate without compromising the integrity of the setup, and it provides a logical reference for managing risk through a structure-based stop rather than a fixed value.
4. Wait For A Confirmation Or Not
The decision to wait for additional confirmation depends on your risk tolerance as entering as early as possible would lead to more profits. We prefer to enter immediately after the fifth candle has closed above the fourth, treating the pattern as a complete signal. This approach allows for earlier entries and stronger reward-to-risk ratios, but it also leaves less room for filtering out false breakouts, which can be common in weaker setups or during low-volume periods.
However, you can take a more cautious approach by waiting for further confirmation, such as a second green candle closing above the fifth or a confluence of supporting signals from volume, RSI, or MACD. This additional layer of confirmation reduces the number of trades but increases the average reliability of the ones taken.
While this method may result in higher entry prices and slightly reduced profit potential, it helps filter out incomplete or deceptive patterns and aligns well with risk-managed strategies that emphasize consistency over frequency. Each method is great, and the choice depends on your experience along with your preferred risk balance.
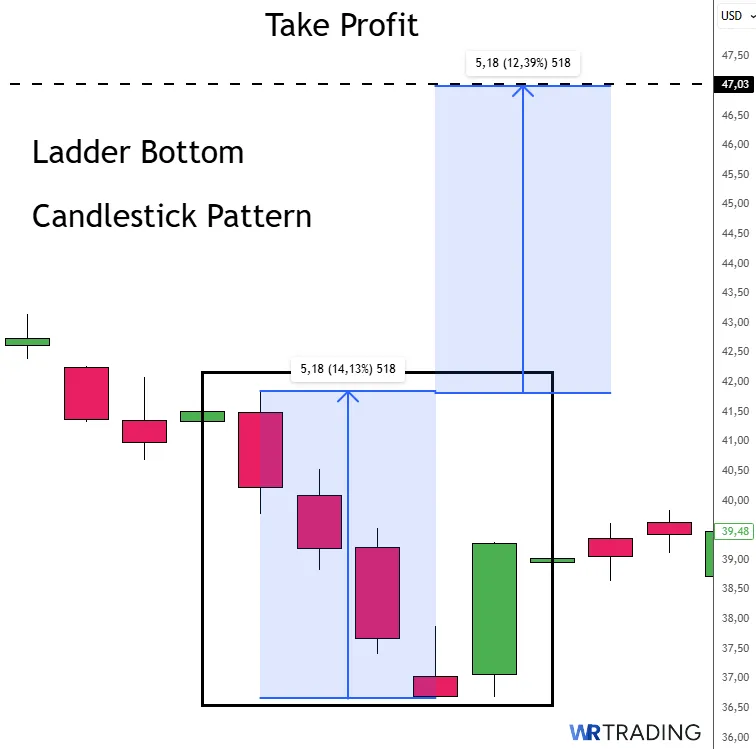
5. Choose Your Trading Take Profit
The placement of your take-profit should always reflect the surrounding price structure and the natural limits of the move. One effective method is to measure the vertical distance from the lowest point in the five-candle formation to the closing price of the final bullish candle, and then project that same distance upward from the entry. This projection-based approach takes the scale of the reversal and provides a realistic target that mirrors the size of the move the pattern is attempting to correct.
Another reliable method is to use visible resistance levels that have acted as barriers during previous price action, like prior swing highs or broken support levels that may now act as resistance zones. These areas are more likely to attract seller interest again, and therefore provide logical exit points based on market behavior.
(Learn To Trade And Read Candlestick Patterns Like A Pro)
Which Strategies Can Be Used For The Ladder Bottom Candlestick Pattern?
The Ladder Bottom pattern works best when paired with a strategy that give it structure and context as relying on the five candles alone will leave you exposed to false signals. However, combining the pattern with support zones, momentum shifts, or breakout levels helps define when it’s worth trading. Here are three trading strategies that integrate the Ladder Bottom into full setups:
- Using Volume Confirmation to Validate the Reversal
- Reversals Built on Pre-Marked Support Zones
- RSI Divergence with Structural Completion
1. Using Volume Confirmation to Validate the Reversal
When a Ladder Bottom pattern completes with increasing volume into the final candle, it signals a more reliable shift in pressure. A common trait of failed reversals is that they appear during periods of thinning volume where no meaningful commitment is present from either side. In contrast, a successful Ladder Bottom will show a decline in volume over the first three or four candles, followed by a sharp increase as the fifth candle closes above the previous high.
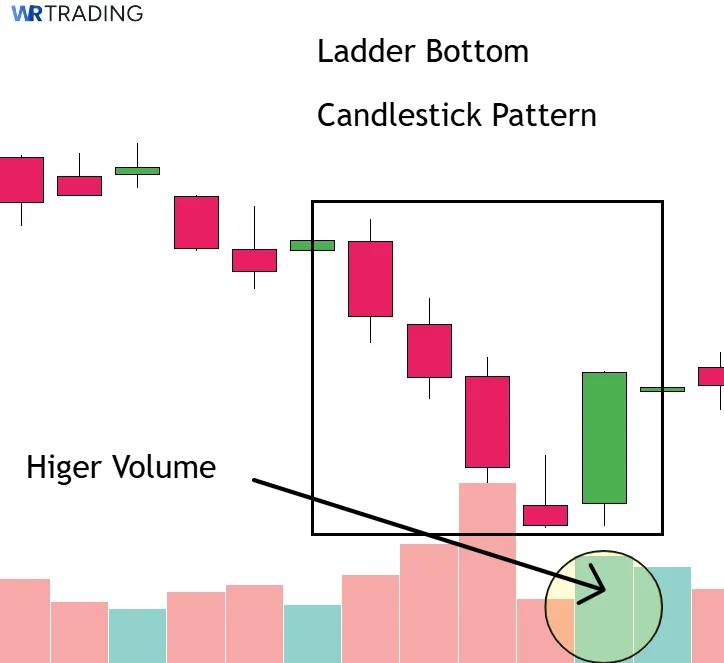
Instead of entering the green candle of the pattern, the better approach is to study how the volume behaves relative to the price movement. Look for the increase in volume to align directly with the close of the final green candle. A clean signal includes a surge that either breaks the volume highs from the earlier bars in the pattern or closes the candlestick with the highest daily reading in the past several candles.
Enter a long position when the fifth candle completes and the stop should be placed below the lowest low of the entire five-candle formation. Targets for this strategy can be set at prior resistance zones or by using a projected range based on the height of the pattern.
2. Reversals Built on Pre-Marked Support Zones
A Ladder Bottom pattern gains more reliability when it appears near a support zone that has already shown historical relevance. Support levels that caused previous rebounds are watched by larger traders, and those same areas tend to attract renewed interest when tested again. If the Ladder Bottom forms just above such a level, the pattern not only shows structural reversal potential but also aligns with broader market history.
Before the pattern appears, draw horizontal levels at prior reaction lows from the higher timeframe. These zones should be formed by multiple touches, clear bounces, or former consolidation floors that acted as springboards for past price advances. As the Ladder Bottom develops, observe how the candles interact with the zone. A meaningful pattern will hold just above or inside the support area without violating the core structure of the zone.
In this strategy, once the fifth candle confirms by closing above the fourth, entry can follow without delay. The stop-loss belongs beneath both the pattern’s low and the lower edge of the support area. Profit targets should be based on the next swing high or an opposing area of resistance that capped the most recent rally.
3. RSI Divergence with Structural Completion
RSI divergence can strengthen a Ladder Bottom pattern when used to confirm a slowdown in bearish momentum. A valid divergence appears when the price makes a lower low during the third or fourth candle, but RSI prints a higher low during the same sequence. That change shows the market is losing downside strength, even though the price may still be pushing lower. The pattern becomes more reliable when this divergence occurs as the Ladder Bottom finishes forming and RSI begins rising before or during the final candle.
Use a standard 14-period RSI on the same chart timeframe where the pattern is visible. Watch for the RSI to form a higher low between the third and fifth candle, creating a visible separation in slope that supports the idea of weakening momentum. The fifth candle must close above the fourth candle’s high while RSI shows a clear climb away from the lower band, confirming that buyers are starting to reassert pressure.
Enter the trade once the pattern completes and the divergence remains intact. Place the stop below the lowest point in the five-candle structure to protect against further downside, and set targets based on nearby resistance or projected ranges. If RSI approaches the upper band in this strategy or begins flattening as the price moves higher, that can be used to manage the exit or begin scaling out of the position.
(Learn To Trade And Read Candlestick Patterns Like A Pro)
What Is The Success Rate Of The Ladder Bottom Candlestick Pattern?
According to Thomas Bulkowski, the Ladder Bottom performs as a bullish reversal pattern in 56% of observed cases. This places it just slightly above random chance, making it one of the lower-performing reversal setups in his research. However, other sources state that it has a much higher rate of over 72%.
In our experience, we achieved 72.4%, since the Ladder Bottom performed better when combined with additional tools that bring more context to the setup. Indicators such as RSI, volume surges, or proximity to support levels can help confirm that the shift in price action is more than just temporary relief during a downtrend.
Is the Ladder Bottom Candlestick Pattern Suitable For Beginners?
Yes, the Ladder Bottom can suit beginners when it’s used with clear confirmation and a basic understanding of price action. The five-candle layout is easy to recognize, and the strong close on the final candle gives a clear visual cue that the selling pressure has broken.
Beginners tend to make mistakes when they treat the pattern as a guaranteed reversal instead of checking what the broader market is doing. A clean Ladder Bottom at a well-defined support zone, backed by a rise in volume or a shift in RSI, is far more reliable than one appearing in the middle of random price movement.
Used with simple tools that confirm direction, the pattern can help newer traders build a consistent process around spotting and reacting to reversal setups.
What Are the Pros and Cons of Trading the Ladder Bottom Candle Pattern?
The Ladder Bottom can be a dependable pattern for identifying bullish reversals, provided that it forms in the right conditions. Its structure is consistent, which allows traders to spot it easily, and the final green candle shows a visual cue of shifting momentum. The entire sequence works best when it appears near established support along with confirmation tools, like rising volume.
However, the pattern has weaknesses that should be understood to prevent entering into a false signal. It can form in locations where the price lacks direction or context, making the signal less reliable than it first appears. Also, without targets built into the structure and no real guidance for exits, traders must rely on other tools to manage risk and reward. These are the main five advantages and disadvantages that define how the Ladder Bottom performs in live conditions.
Pros
- The final green candle acts as a momentum shift trigger
- Clear visual sequence that simplifies identification
- Effective when layered with support levels
- Defines risk through structural lows
- Reliable on higher timeframes where price action is more stable
Cons
- Appears frequently in low-quality locations
- Easy to misinterpret for newer traders
- Does not provide built-in price targets
- Becomes unreliable away from technical levels
- Often fails during strong trends
What Are The Advantages Of The Ladder Bottom Pattern?
Trading reversals can feel subjective, but the Ladder Bottom helps reduce that guesswork by offering a clean, repeatable structure. It shows a gradual breakdown in bearish momentum and highlights a moment where buyers begin to gain momentum. From its visual layout to the clear stop placement it provides, the pattern gives traders tools they can work with across multiple timeframes. Below are the practical advantages that make this pattern useful in real setups.
- The final green candle acts as a momentum shift trigger: The fifth candle in the Ladder Bottom closes above the previous bar’s high, which shows a visible and meaningful change in pressure. This candle is not just a bounce but a sign that buyers are stepping in with stronger conviction. It helps traders avoid guessing and instead base their entries on a specific event within the price action.
- Clear visual sequence that simplifies identification: The Ladder Bottom’s five-candle layout is fixed, meaning there’s no ambiguity about what qualifies. Each candle in the sequence plays a defined role, making it easier to identify on live charts without second-guessing. This is helpful for traders who rely on visual setups and want to standardize their process across multiple markets.
- Effective when layered with support levels: The signal becomes stronger when it occurs near a major support area, such as a previous swing low or range base. The Ladder Bottom in that position shows not only technical rejection but a behavioral shift, where buyers defend a key zone. This adds a second layer of logic to the trade and increases the chances of a sustained bounce.
- Defines risk through structural lows: The lowest wick within the pattern offers a logical point for stop-loss placement. Since that level represents the final exhaustion of sellers, placing stops beneath it follows the internal logic of the formation.
- Reliable on higher timeframes where price action is more stable: The Ladder Bottom tends to work better on 4h or daily charts, where each candle shows a more meaningful stretch of time. On these timeframes, the five-bar structure captures broader sentiment shifts rather than short-term noise. This allows the setup to unfold more clearly and produce signals that are based on real shifts in market pressure rather than random movement.
(Learn To Trade And Read Candlestick Patterns Like A Pro)
What Are The Disadvantages Of The Ladder Bottom Pattern?
Not every Ladder Bottom leads to a reversal, and that’s where the risks of the pattern begin. It’s a pattern that requires confirmation, context, and a plan for exits, none of which are built into the structure itself. New traders often mistake weak versions of it for valid signals, and without support zones or momentum tools, that leads to inconsistent results. These are the most important disadvantages to consider when using this formation.
- Appears frequently in low-quality locations: The Ladder Bottom can form in the middle of ranges or during sideways movement, where the price lacks direction and momentum is unclear. In those environments, the Ladder Bottom may reflect nothing more than short-term noise rather than a true shift in sentiment. This leads to frequent false positives and losing trades if you enter.
- Easy to misinterpret for newer traders: Not every group of four red candles followed by a green one qualifies as a Ladder Bottom. Many inexperienced traders mistake similar sequences for this pattern and end up acting on weak or invalid signals. Without strict criteria and experience, the risk of misidentification is high.
- Does not provide built-in price targets: The pattern offers no inherent guidance on where to take profit or exit. Traders need to rely on additional tools like Fibonacci levels, previous highs, or volatility-based targets to manage the trade. This adds complexity and increases the chances of emotional decisions affecting the outcome.
- Becomes unreliable away from technical levels: When the Ladder Bottom appears without support from structure or context, such as in the middle of a trend or without nearby support, its effectiveness drops sharply. There is no anchor point to suggest that buyers have a reason to act. This makes it far easier for prices to continue downward despite the appearance of the setup.
- Often fails during strong trends: If a downtrend is aggressive or news-driven, the Ladder Bottom may only reflect a temporary pause in price action. Traders who enter against strong momentum without confirmation often get stopped out quickly. The pattern needs a clear sign that the larger trend is weakening before it can be trusted.
Can the Ladder Bottom Pattern Have Failure Signals?
Yes, although the Ladder Bottom presents a structured reversal formation, it can fail in a number of common scenarios. These failures come from misinterpretation, poor market context, or a lack of supporting confirmation. Recognizing when the pattern is likely to break down can help avoid false entries and protect your capital.
- No real shift in volume or momentum: If the final green candle forms without an increase in volume or a sign of buyer activity, the pattern lacks strength. A weak fifth candle, even if it closes higher, may reflect nothing more than short covering or short-term rebalancing. Without added momentum, the Ladder Bottom has no foundation for a sustained move upward.
- Pattern forms inside a broad range or sideways market: When the Ladder Bottom appears in a flat or ranging chart, the reversal signal carries less meaning. These zones are filled with erratic moves that often trap traders into premature entries. A reversal setup in this context can easily reverse again within the same range.
- No nearby support level to anchor the setup: A Ladder Bottom with no structural support underneath is vulnerable to being overrun. Without a swing low, demand zone, or consolidation base below, there’s no reason for buyers to defend that area. The lack of a technical floor weakens the reliability of the bounce.
- The fifth candle fails to close above the fourth: If the final green candle closes within the body of the fourth candle or barely above its open, the shift in momentum is incomplete. That candle needs to show a clear rejection of lower prices and assertiveness from buyers. A weak finish leaves the pattern undecided and prone to failure.
- The overall downtrend remains strong and intact: When the larger trend shows aggressive selling or lower highs with heavy volume, a small reversal pattern cannot compete with that pressure. Even if the pattern forms cleanly, it may only produce a temporary bounce before the dominant trend resumes.
- No bullish divergence on momentum indicators: The absence of divergence on tools like RSI or MACD makes it difficult to validate the shift suggested by the Ladder Bottom. A valid Ladder Bottom works best when momentum begins to flatten or rise as the pattern forms.
- Broader market is showing strong bearish sentiment: When major indices or correlated assets are falling sharply, the Ladder Bottom may fail even if it looks valid on the chart. Broader sentiment plays a major role in trading decisions, and isolated bullish patterns can get overwhelmed in these conditions.
Which Indicators Can Be Combined With The Ladder Bottom Pattern?
The Ladder Bottom works best when paired with tools that confirm momentum shifts, structural support, or overextension in price. Alone, the pattern shows a potential reversal, but that signal becomes much more reliable when filtered through confirmation. The following indicators can help avoid weak setups and focus on entries with stronger context.
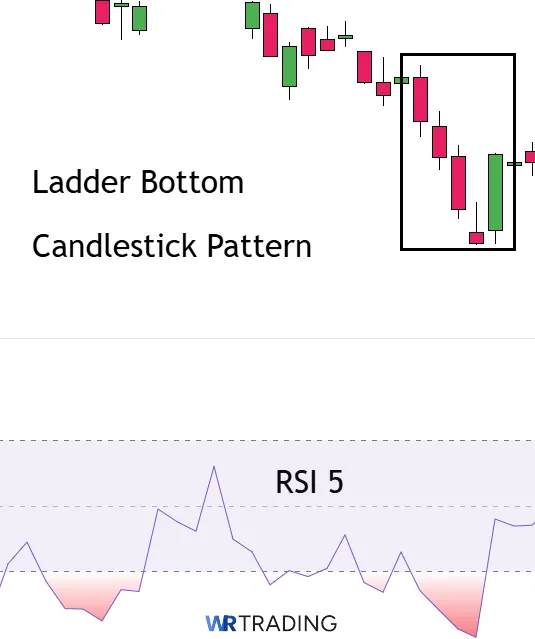
- Relative Strength Index (RSI) – 5 or 7 period, close: Using a short-period RSI allows traders to spot short-term momentum shifts near the end of the Ladder Bottom. When the Ladder Bottom forms during a lower low in price but the RSI shows a higher low, that bullish divergence adds strength to the setup. Wait for RSI to cross above 30 or the midpoint to confirm early upside pressure. This works well on intraday and swing timeframes when the price structure alone isn’t enough.
- Volume: Volume confirms how much participation is behind the bounce. If the final green candle in the Ladder Bottom prints with a clear surge in volume, it confirms buyer strength. When volume fades during the decline and returns sharply on the reversal, the shift becomes more reliable. Traders can also compare the relative volume to the last five candles to see the significance of the move.
- Fibonacci Retracement – Use swing high to low of the recent move: After identifying a Ladder Bottom, Fibonacci levels can help map out logical target zones. The 38.2% and 61.8% retracement levels can show short-term resistance where partial profits can be taken. These levels help give structure to the trade’s exit. They also allow traders to assess the strength of the reversal based on how far the price pushes into the retracement range.
- Moving Average Convergence Divergence (MACD) 12, 26, 9: MACD helps confirm the momentum shift behind the Ladder Bottom, ideally when a bullish crossover occurs near the final bar. When the MACD histogram starts climbing back toward zero while the price shows a reversal structure, it supports a continued move higher. Crosses above the signal line or increasing histogram bars offer early signs of changing direction. MACD is most useful on the 1h to daily timeframe charts to reduce noise.
What Are Similar Patterns To The Ladder Bottom Pattern?
It helps to know what other patterns you can use when the Ladder Bottom doesn’t form since strong reversals can appear in different variations depending on momentum, timing, and market conditions. Here’s a breakdown of those alternatives and when they’re most useful.
| Pattern Name | Main Characteristics | Best Use Case |
|---|---|---|
| Morning Star | A three-candle reversal that forms at the bottom of a downtrend | Used to signal a shift from bearish momentum into early bullish control after extended selling |
| Bullish Engulfing | A two-candle pattern where buyers overpower previous selling | Best used after pullbacks in trending markets or at the base of a range |
| Three Inside Up | A reversal with internal confirmation built into the second and third candles | Most effective after a slow decline or consolidation zone |
| Piercing Line | A strong two-candle reversal that gaps down then recovers | Useful after high volatility declines or news-driven drops |
| Three White Soldiers | A strong continuation or reversal made up of three rising candles | Best used after a failed sell-off or break of consolidation |
Learn more about candlestick formations by downloading our free candle stick chart pattern pdf!
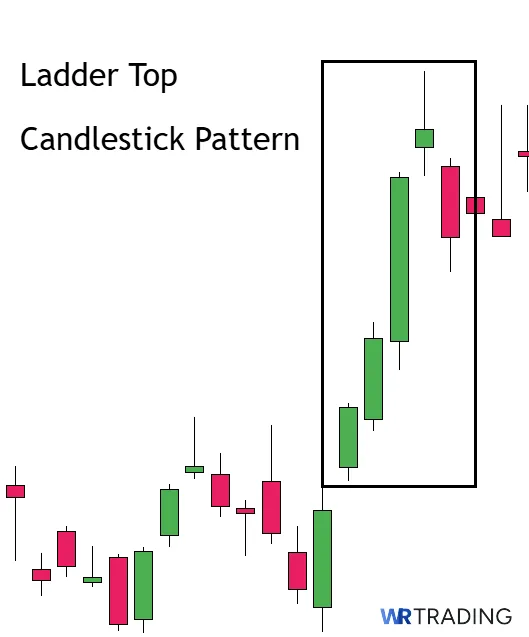
What Is The Opposite Pattern Of The Ladder Bottom?
The opposite of the Ladder Bottom is the Ladder Top pattern. The Ladder Bottom forms after a decline and signals a bullish reversal, while the Ladder Top appears during an uptrend and reflects weakening buying pressure that may lead to a reversal to the downside. Both patterns rely on a five-candle structure, but their progression moves in reverse directions.
(Learn To Trade And Read Candlestick Patterns Like A Pro)
What Is The Difference Between The Ladder Bottom And The Ladder Top Candle Pattern?
The main difference between the Ladder Top and Ladder Bottom are the conditions they form in and the direction they point to. The Ladder Bottom shows up after a clear downtrend and builds through four red candles that show steady selling but ends with a green candle that breaks above the previous high and signals that buyers are stepping back in with strength.
The Ladder Top flips that structure upside down, forming during an uptrend with four green candles showing ongoing demand, followed by a red candle that closes below the fourth, showing that sellers are beginning to push back with more pressure.
Even though the layout is identical, the meaning behind each version moves in the opposite direction. The Ladder Bottom shows exhausted selling met by renewed buyer strength, while the Ladder Top reveals fading buying pressure overtaken by sellers looking to reverse the trend.
| Section | Ladder Bottom | Ladder Top |
|---|---|---|
| Main Characteristics | Forms at the end of a decline where persistent selling is finally met with strong buying interest, leading to a possible reversal in direction. | Appears after a sustained uptrend where buying pressure has gradually weakened, opening for sellers to regain control and reverse the price action. |
| Construction | Candle 1: Red candle closing lower with strong selling momentum. Candle 2: Another red candle that continues the decline with a lower close. Candle 3: Red candle with a push downward. Candle 4: Compact red candle that signals indecision or fading pressure from sellers with a long upper wick. Candle 5: A green candle that closes above the fourth candle’s high and breaks the bearish sequence. | Candle 1: Green candle showing strong buying pressure and upward continuation. Candle 2: Another green candle that pushes higher, extending the rally. Candle 3: Green candle pushing the price higher. Candle 4: Narrow-bodied green candle that suggests hesitation or loss of momentum with a lower long wick. Candle 5: A red candle that closes below the fourth candle’s low, breaking the rising structure and confirming a shift in sentiment. |
| Forecast | Signals the selling phase has likely ended and the market may shift upward if buyers continue to apply pressure beyond the final candle. | Suggests that the buying streak has lost strength and a downward reversal is becoming more likely as sellers step back into the market. |
| Type of Pattern | Five-candle bullish reversal pattern | Five-candle bearish reversal pattern |
| Trend Prior to Pattern | Develops after a consistent downtrend where bearish momentum has been dominant for several candles. | Forms during a strong upward move where buyers have been in control but are showing signs of fatigue. |
| Best Use Case | Best used near major support levels or exhaustion zones where selling has dried up and confirmation tools show early signs of a shift toward higher prices. | Most effective when seen at market tops, ideally when the price has overextended and key resistance areas coincide with signs of weakening demand. |
Does a Bearish Ladder Bottom Exist?
No, there is no such pattern as a Bearish Ladder Bottom. The Ladder Bottom is a bullish reversal pattern by definition, and its structure is built to reflect a specific shift from sustained selling pressure to renewed buying interest.
What Are The Limitations Of The Ladder Bottom?
The Ladder Bottom can offer a clean reversal setup in the right conditions, but it also has several limitations that traders need to consider before using it as a signal. The pattern depends heavily on confirmation and context, and without these supporting elements, it can lead to inconsistent results or misleading entries. These are the main limitations to keep in mind when evaluating a Ladder Bottom on the chart:
- The pattern appears in weak or noisy locations, which makes it difficult to rely on without additional structure or volume signals.
- Without a trend or clear directional context, the Ladder Bottom may fail to produce meaningful follow-through.
- The final green candle can sometimes be weak or indecisive, which creates doubt about whether true momentum is shifting.
- The pattern becomes unreliable during news-driven drops, where sentiment can override technical structures.
- It requires five full candles to develop, which can be slow and impractical for intraday strategies.
Learn Pattern Trading With the WR Trading Mentoring
Many traders can recognize candlestick patterns like the Ladder Bottom, but most struggle to apply them effectively in fast-moving markets without a structured strategy. The ability to spot a signal means very little without knowing how to confirm it, assess the surrounding price environment, and control risk through smart trade management.
The WR Trading Mentoring program focuses on all these aspects and practical development by teaching you how to use price action patterns within a broader decision-making process. Instead of memorizing setups, you learn how to evaluate their reliability based on context, volume behavior, support zones, and confirmation tools.
Each concept is backed by examples, market walkthroughs, and a clear system that connects pattern structure to actual trade logic. Consider joining if you want to improve your trading skills and avoid unfavorable trades.
(Learn To Trade And Read Candlestick Patterns Like A Pro)
Conclusion: The Ladder Bottom Is A Reliable Signal When Confirmed with Volume
The Ladder Bottom offers a clear signal that helps traders understand when selling pressure has likely run its course and buyers are beginning to take control. Its five-candle design is not just a matter of pattern recognition, but a useful way to track the progression of market sentiment through a defined sequence. Traders who combine this pattern with context, confirmation tools, and proper execution planning can find it valuable in spotting high-quality reversals.
In our guide, we covered every part of the pattern, from formation and trader psychology to strategy, confirmation methods, failure signals, and related patterns. We explained how to interpret the signal, where to apply it, and what to avoid. When approached with the right strategy and filters, the Ladder Bottom can provide reliable opportunities for those who understand how to use it.
FAQs: Most Asked Questions on the Ladder Bottom Candlestick Pattern
Can the Ladder Bottom Appear on Any Timeframe?
Yes, but the pattern works best on 4h and daily charts where each candle reflects more meaningful price behavior. Lower timeframes create too much noise, making the setup less reliable and harder to interpret.
Does Volume Matter in Ladder Bottom Formations?
Yes, volume is important on the final green candle because a noticeable increase in volume during the last bar confirms that buyers are overwhelming sellers. When volume remains flat, the Ladder Bottom becomes less convincing and may not hold.
Is the Ladder Bottom a Standalone Entry Signal?
No, it performs best when paired with supporting structure such as horizontal support, trendlines, or oversold conditions. While the pattern offers a clear visual shift, using confirmation tools helps filter out false setups. Relying only on candle sequence without additional context leads to weak trades.
How Do I Set a Stop-Loss Using This Pattern?
The ideal stop loss is placed just beneath the lowest low within the five-candle structure. That level reflects the final extension of selling before buyers stepped in, making it the cleanest point to define risk. Placing stops too close or beneath a single candle can lead to unnecessary exits.
Does News Impact the Ladder Bottom’s Reliability?
Yes, external catalysts can override technical patterns, even well-formed ones. If a strong news release hits during or after the formation, the price may move sharply regardless of the signal.