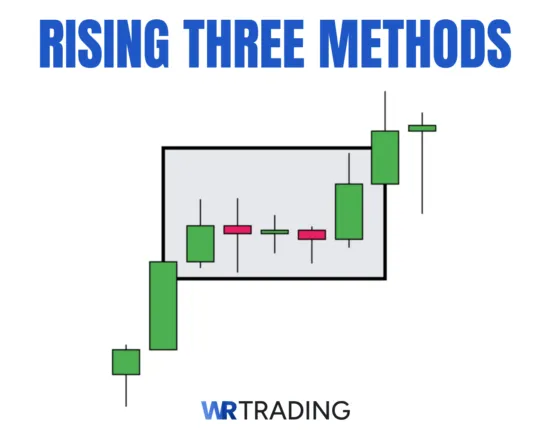
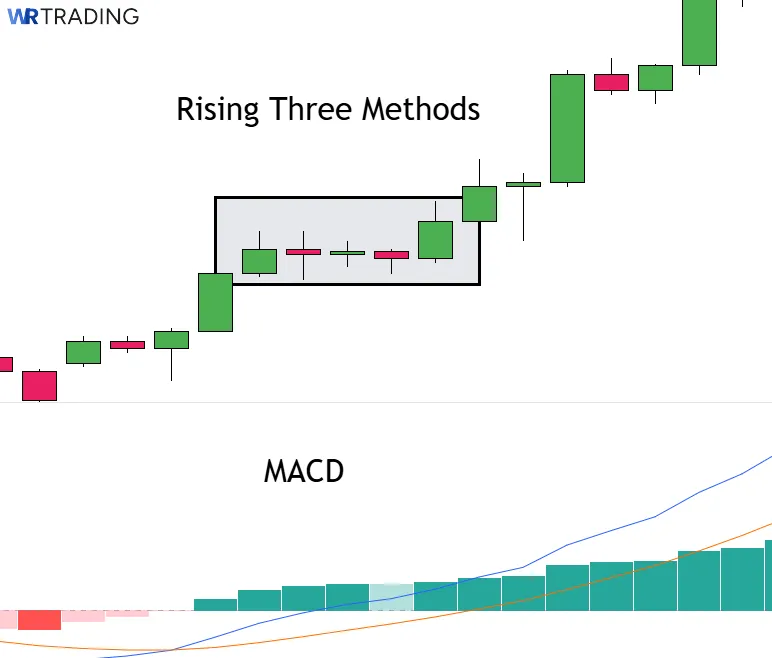
The rising three methods is a rare five-candlestick bullish continuation pattern that typically forms during an established uptrend. It begins with a strong bullish candle, followed by three smaller bearish or neutral candles that remain within the range of the first. The structure is completed by another solid bullish candle that closes above the first candle’s high.
Together, these components signify temporary consolidation before buyers regain control. Traders often look to enter long positions after the fifth candle confirms the upward momentum, especially when paired with supportive indicators or trendline validation.
This pattern is considered one of the more accurate candlestick methods in identifying trend continuation in markets like forex trading.
Key Facts about how the Rising Three Methods Candlestick is structured:
- Type Of Pattern: Continuation
- Construction:
- First Candle: Strong bullish candle
- Second-Fourth Candle: Small bearish candles
- Fifth Candle: Strong bullish candle
- Trend Prior The Pattern: Bearish
- Opposite Pattern: Falling Three Methods
- Entry Options: standard entry above the fifth candle, aggressive entry before the pattern completes, pullback after the pattern completes
- Stop-Loss Placement: Below the first candle, below the fifth candle, ATR stop
- Psychology: signals bullish confidence as buyers absorb a brief sell-off
- Success Rate: 74%
In this guide, the Rising Three Methods pattern is fully explained, from its meaning and various strategy types to step-by-step trading steps and live example breakdowns.
(Learn To Trade And Read Candlestick Patterns Like A Pro)
How Is The Rising Three Methods Pattern Formed?
The rising three methods forms after a five-candle sequence in an established uptrend. Here is a breakdown of each candle:
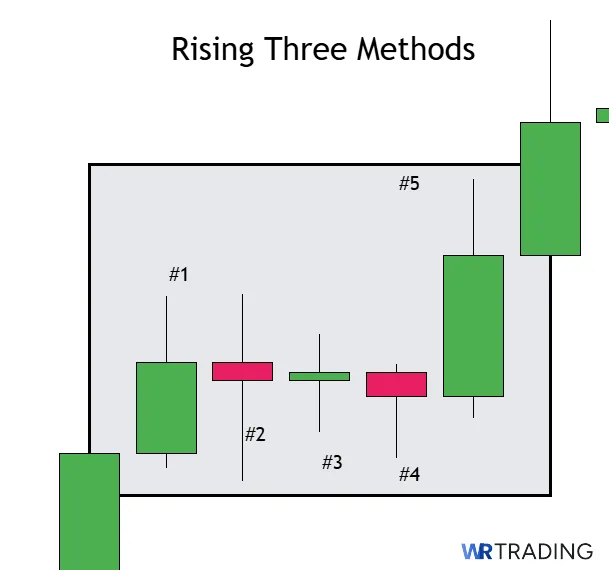
- Candle 1 (Strong Bullish Candle):
The first candle is a long-bodied bullish candle that demonstrates upward momentum. It sets the tone and establishes the range within which the next candles will form. - Candles 2 to 4 (Small Bearish/Neutral Candles):
The next three candles are relatively small and often bearish (or neutral), progressively closing lower. They should remain within the range of the first bullish candle, representing a temporary pullback or pause in the trend. - Candle 5 (Another Strong Bullish Candle):
The final candle is another long bullish candlestick (of similar or greater size to the first) that closes well above the first candle’s high. This indicates that buyers have regained control after a brief pause and are resuming the trend toward new highs.
The time it takes for this pattern to form varies based on the chart. The shorter the time frame, the quicker it appears. For instance, it can occur as fast as five minutes on a 1M chart or as long as five hours on a 4HR chart.
What’s more important is that the setup follows the candle features mentioned here and in a favourable market context (which will be covered later). Also, given its rarity, the pattern may not appear exactly as described on a real chart.
For instance, the fourth candle could slightly breach the first candle’s range. However, the pattern would be valid. So, do allow for such variances while scanning for the pattern.
What Does The Rising Three Methods Candlestick Pattern Mean?
Psychologically, the rising three methods pattern shows that buyers were comfortable enough to allow a minor pullback or consolidation without losing ground after an aggressive push upward.
A bearish attempt was made by the sellers to step in during the middle candles. However, their strength was weak, and they were unable to reverse the trend. The final candle reaffirms the bullish dominance and likely continuation of the uptrend.
Traders view this as a sign of market confidence, where temporary selling is absorbed, and buyers prepare for another leg higher.
Is The Rising Three Methods Pattern Bullish?
Yes, the rising three methods pattern is a bullish continuation pattern. It signals that an existing uptrend is about to resume after a brief period of consolidation, as buyers maintain control despite short-lived selling pressure.
(Learn To Trade And Read Candlestick Patterns Like A Pro)
What Is An Example Of The Rising Three Methods Pattern?
Let’s now look at a real-life example of this pattern on a price chart.
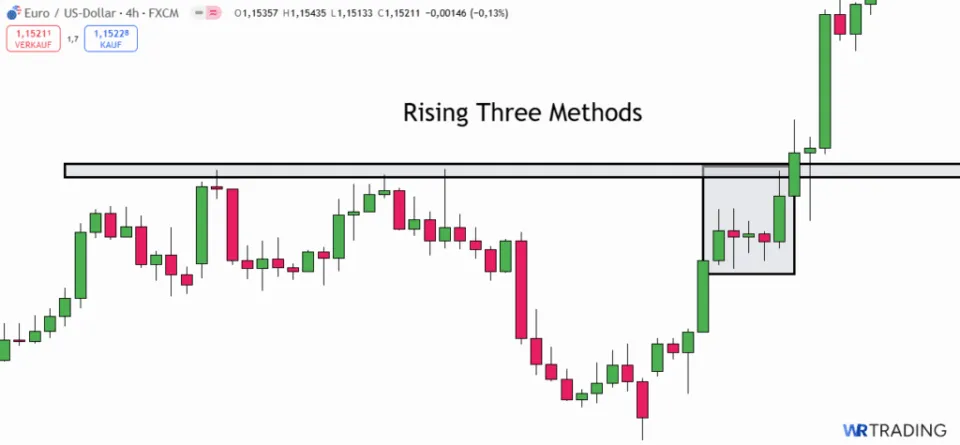
Here are the rising three methods on the H4 time frame of EUR/USD. It appeared on a strong uptrend around the 1.05250 level.
Note the structure: a pin bar, three red candles, and a large bullish candle. The market continued trending higher, reaffirming the formation’s power.
How To Identify The Rising Three Methods Pattern?
Here are the key considerations when identifying the rising three methods:
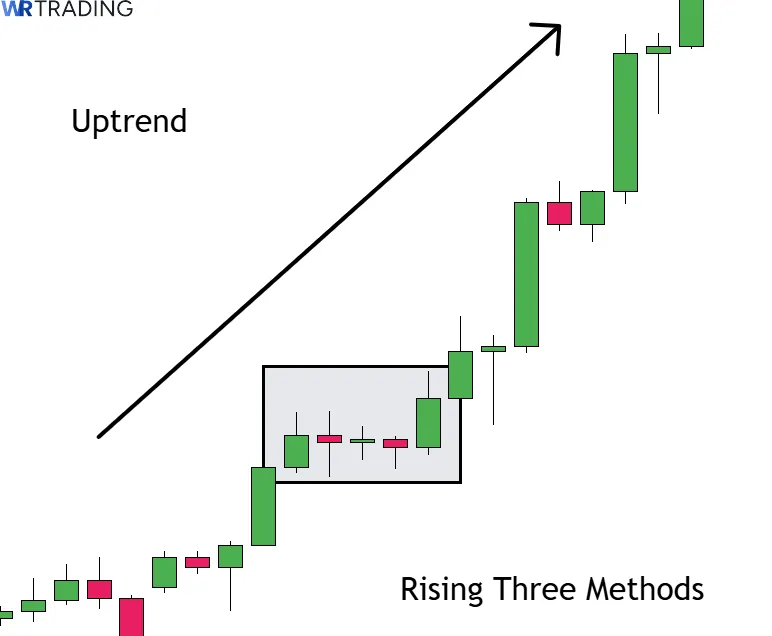
1. Look for an Uptrend
We see the rising three methods in a clear bullish trend. Traders should measure the structure of the previous candles (of which there is no minimum), ensuring a steady upward trajectory with higher highs and higher lows.
Studying trends on higher time frames (from the 4HR and above) is also essential as the pattern forms seldomly. So, you will want to view it on time frames with less noise for better clarity and definition.
2. Scan for The Five-Candle Structure
The first option is to manually search by looking at ‘pause-and-break’ sequences within trends. Look for clusters of small candles followed by a green breakout bar to the upside. While this process is quite time-consuming, a trader can identify perfect formations due to the human discretion involved.
The alternative is to use charting software (like TradingView), which often have community-built scanners for these chart patterns. This can reduce your search time. However, this method doesn’t always identify the most accurate rising three methods. So, you should verify that it meets the strict criteria.
3. Confirm The Pattern’s Location
The three rising methods can appear at any point in a trend. However, it’s crucial to confirm high-probability areas. These include trendlines, Fibonacci retracement levels, pivot points, and moving averages.
It’s also vital to avoid trading the setup near major resistance levels or after a prolonged uptrend showing signs of exhaustion. Both situations suggest a potential bull trap.
(Learn To Trade And Read Candlestick Patterns Like A Pro)
How To Trade The Rising Three Methods Pattern?
Here are summarised steps for trading this setup before exploring each one in greater meaning:
- Find the right setup
- Wait for the appearance of the rising three methods
- Open your trade (including adding a stop loss)
- Decide on a profit target
1. Find the Right Setup For The Rising Three Methods
A clear uptrend is the first prerequisite for a right setup. On rare occasions, you could identify the formation at the beginning of a new uptrend following the reversal of a previous downtrend.
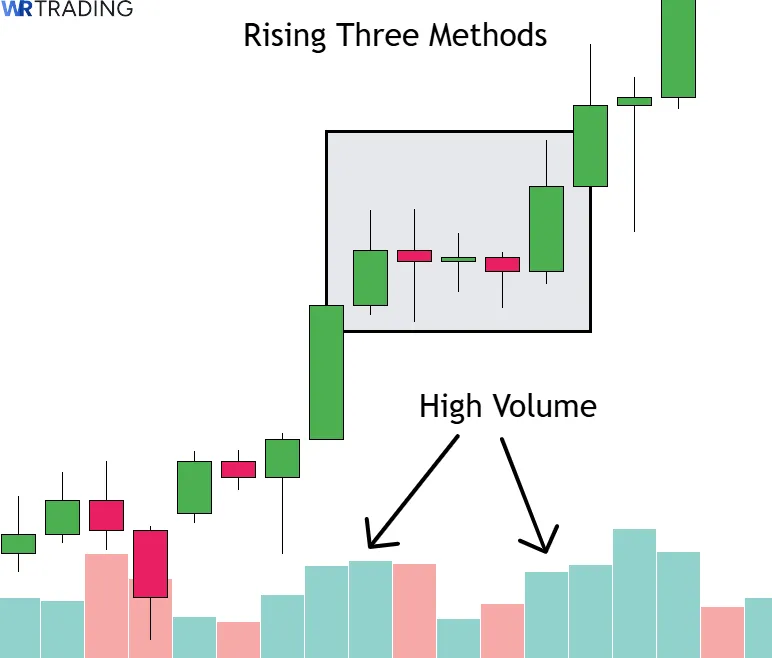
Another useful factor in finding the ideal conditions is to analyse the volume:
- First and last bullish candles should have higher volume.
- Middle candles show declining volume, indicating weak pullback.
Finally, as a recap of the previous identification guidelines:
- Avoid rising three methods appearing in prolonged trends or near major resistance levels
- Look for appearances near natural turning points like recent support areas, trendline, and moving averages
2. Wait For The Appearance Of The Rising Three Methods Candlestick Pattern
Ensure the exact structure is in place for the pattern on a high time frame:
- Candle 1: long-bodied bulllish candle with minimal wicks
- Candle 2-4: small bearish candles in the range of the bullish candle
- Candle 5: long-bodied bullish candle surpassing the high of candle 1
Let’s now go through examples of entering this trade.
3. Open Your Trade – Entry Point
Once the proper setup is in place and the appearance of the rising three methods is complete, the next step is to consider the different types of entry techniques.
Standard Entry
The simplest way to enter the rising three methods is to wait for the breakout above the fifth candle after it has closed.
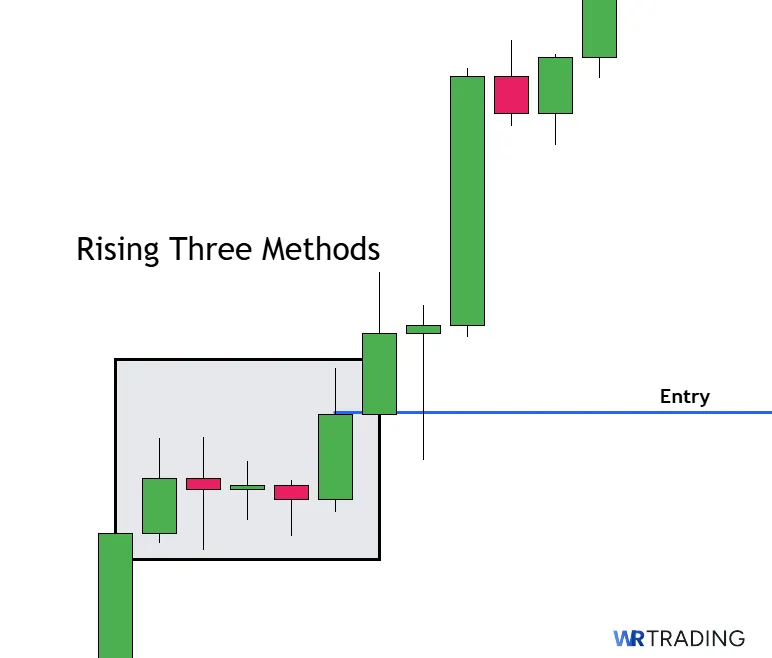
This approach is fairly balanced: you get an immediate fill and enter at an ideal time within the setup. However, there are other entry techniques with better risk-to-reward.
Aggressive Entry
Confident traders may enter once the fifth candle has broken the high of the first. You would need several strong confirmation factors. One would be rising volume on this candle or bullish price action patterns on smaller time frames.
It’s a riskier approach since the fifth candle wouldn’t be closed. Still, it offers a much better entry point.
Pullback Entry
Finally, we have a pullback entry. Following the close of the fifth candle, a trader waits for a retest. This could be on a 50% retracement level, a moving average, or another nearby support area. Using a lower time frame can help you identify any of these.
Regardless, the purpose is to enter on this bounce, offering a more favourable entry price and tighter stop loss than the other methods. The only disadvantage is that the market may keep moving higher instead of pulling back. Considering the rarity of the rising three methods, it could be wiser to explore the other entry options.
Once the entry point is set, traders should also know where to place their stops. Here are a few options:
- Below the first candle: Most common and balanced technique
- Below the fifth candle: Slightly more aggressive technique but with a tighter stop)
- ATR stop: The Average True Range indicator can provide the ideal movement range based on the time frame. This can help a trader determine how wide their stop loss should be.
It is useful to have the stop wider than the given range to be on the safe side. This approach is more in line with real market conditions, using volatility as a benchmark. In some cases, one may receive a tighter stop (but the opposite also applies, depending on the circumstances).
4. Choose Your Trading Take Profit
After the proper stop loss technique is chosen (and you’re lucky that the price is moving favourably), it’s time to take profits. Here are your options for doing so:
- Use previous resistance levels or price structure: This represents the most natural price targets since they are turning points that markets react to. So, check for key horizontal resistance, previous swing highs, pivots, and psychological levels.
- Use the Fibonacci tool: Fibonacci is also based on resistance areas. However, you can trade more specific ones like 50%, 61.8%, 78.6%, and even further extension levels like 138.2% and 161.8%.
- Trailing profits with trend strength: Using the methods already discussed, you may trail your stop instead of aiming for a fixed target. This allows one to remain in the position for as long as possible.
Fibonacci can work really well here. For example, you could move your stop to breakeven when the price hits 23.6%, then to 23.6% when it reaches 50%, then 50% when it hits 61.8%, and so on.
Whatever the chosen approach, aim for a minimum 1:3 risk-to-reward ratio where possible. Let’s now look at a real chart example of the rising three methods on the USD/CAD daily chart.
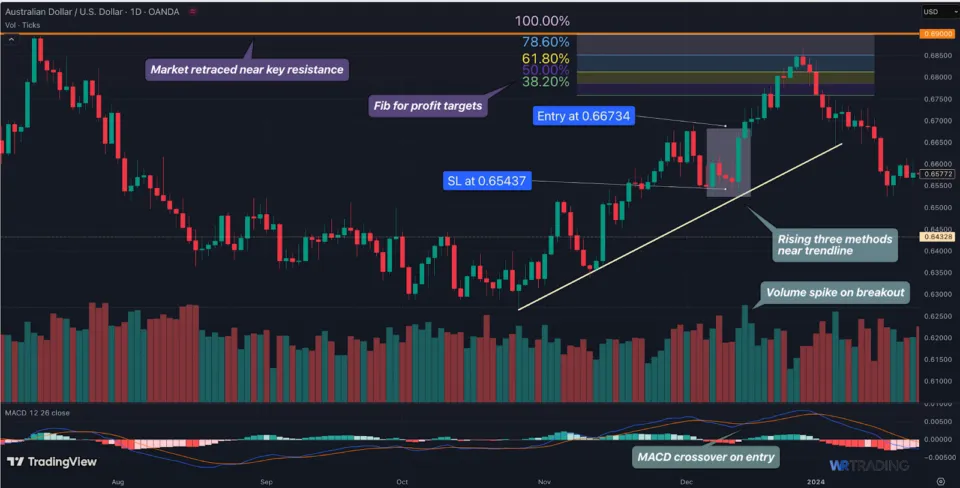
The first notable signal here is that the pattern occurs near a trendline, reinforcing the importance of having a trend for this setup. The entry part of this position also showed worthy clues. The first is the MACD crossover, followed by a volume rise, both of which would have been strong bullish factors.
An entry would have happened at 0.66734 with a stop loss at 0.65437 below the fifth candle. Notice how the market retraced close to the key resistance, proving it’s an important area to watch when taking profits. The Fibonacci would have been used in this regard, as the setup lost steam at the 78.6% level.
(Learn To Trade And Read Candlestick Patterns Like A Pro)
Which Trading Strategies Are Suitable For The Rising Three Methods Pattern?
Here are several trading strategies suitable for the rising three methods pattern:
- Volume breakout entry: This strategy involves waiting for the pattern to form completely before entering after the breakout. Watch for a rise in volume on the last candle for extra confirmation. The stop would be placed below the fifth or third candle.
- RSI confirmation: You can use the RSI to enter and exit your trades. Look for the market to be above 50 during the formation of the trade before entry. Then, you can consider closing the trade once the RSI is above 70 and starts dipping below this number.
- Bollinger band squeeze: Here, a trader identifies a squeeze with the Bollinger Bands before or during the pattern’s formation. Then, they would wait for the fifth candle to exceed the upper band, confirming the expansion of volatility. The entry happens at the close of the breakout, with a stop placed inside the upper band below the fifth candle’s low.
- Rising three inside a channel: This strategy involves identifying a bounce of the pattern on an ascending channel or trendline (as seen in our chart example). Traders can enter after the fifth with stops below the fifth or third candles.
What Is The Success Rate Of The Rising Three Methods Candlestick Pattern?
The rising three methods has an impressive 74% success rate according to the sources below:
- Candlestick Patterns and Their Predictive Power in Financial Markets report by the Financial Markets Research Center
- Encyclopedia of Candlestick Charts by Thomas Bulkowski
Interestingly, Bulkowski indicated that he found 102 examples of the pattern in 4.7 million candle lines, reaffirming how rare this setup is.
Despite the studies, the accuracy of this formation ultimately depends on market conditions and additional confirmation. So, always factor in other indicators, higher time frames, and solid risk management when learning how to trade the rising three methods.
(Learn To Trade And Read Candlestick Patterns Like A Pro)
What Are The Pros And Cons Of The Rising Three Methods Pattern?
Below you can see the Pros and Cons of the Rising Three Methods:
Pros
- High success rate
- Compatibility with various technical tools
- Ease of trend continuations compared to reversals
Cons
- The pattern is infrequent
- Subjectivity in candle formation
- Greater stop loss size is typically needed
- Vulnerability to economic events
What Are The Advantages Of The Rising Three Methods Pattern?
Key advantages include the pattern’s excellent success rate, compatibility with various indicators, and ease of trading.
- Accurate setup: Research indicates this pattern has a high chance of contributing to a trend continuation. Part of the reason is that the rising three methods seldom appear, making it a standout in the market.
- Works with other indicators: Combining volume analysis, moving averages, or RSI/MACD can improve the trade’s quality or confidence.
- Easier to trade than reversal patterns: Generally, trading trends is easier than reversals since the momentum is already in your favour. The rising three methods is primarily present in this scenario.
What Are The Disadvantages Of The Rising Three Methods Pattern?
The main limitations are the pattern’s infrequency, its subjectivity to interpretation, the need for a wider stop loss, and vulnerability to news events.
- High infrequency: Identifying this pattern is challenging, partly because it hardly appears on the charts. Thus, it’s not a formation to rely on all the time.
- Subject to interpretation: Due to this rarity, it becomes almost impossible to find a textbook setup that follows the size and range of the candles exactly. So, it’s easy for traders to force-fit the rising three methods.
- Greater stop loss size is typically needed: The stop loss when trading the rising three methods often needs to be wider, considering the range caused by the combination of the first and last bullish candles.
- Vulnerability to news events: Since the pattern unfolds over multiple candles (typically 4–5), it is sensitive to sudden market news or macroeconomic events that can instantly invalidate the setup.
Can The Rising Three Methods Have Failure Signals?
Yes, as evidenced by its success rate not being close to 100%. The causes include the absence of confirmation, timing, market context, and other external factors beyond a trader’s control.
However, there are other similar alternatives to explore like the bullish harami and three white soldiers.
Which Indicators Can Be Combined With The Rising Three Methods to Increase Its Success?
Here are the following indicators you can use with the rising three methods to increase its success rate:
Relative Strength Index (RSI)
The RSI is a momentum indicator that displays overbought and oversold conditions. With the rising three methods, it can tell you whether the market has finished retracing (by moving from oversold) and potentially moving to the other side. The RSI is also useful for divergences.
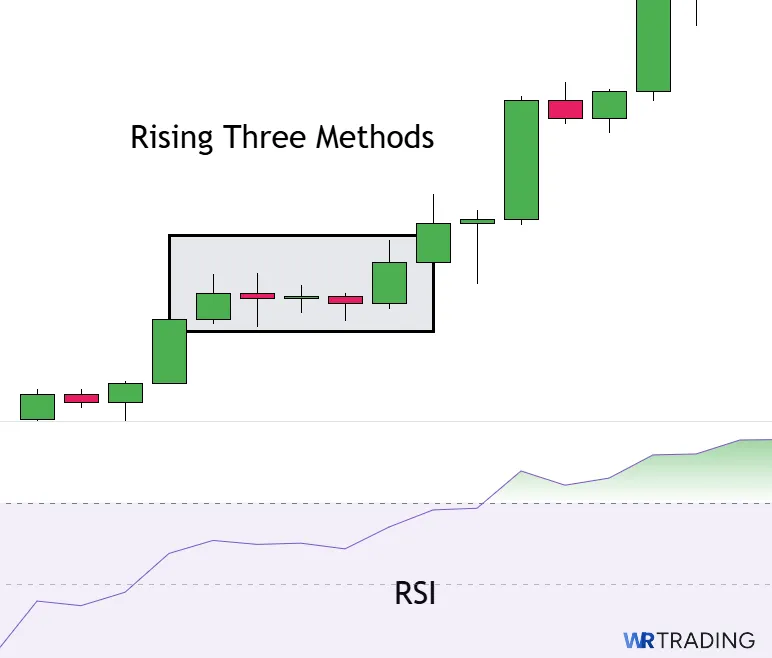
Ideal Setting: 14-period RSI (standard)
Moving Averages
Moving averages demonstrate the dominant trend. So, seeing the price above a specific MA can be a bullish confirmation. Another notable clue is to look for the rising three methods near or on the MA (i.e., ‘dynamic resistance), suggesting a solid retracement and a chance for the market to move high.
Ideal Settings:
- 50 EMA for short- to mid-term trend bias
- 100 EMA for longer-term trend context
MACD (Moving Average Convergence Divergence)
The MACD tracks trend and momentum by comparing two moving averages. It can show a bullish crossover once the rising three methods has formed, providing an excellent layer of confirmation.
Ideal Settings: 12, 26, 9 (standard)
Bollinger Bands
This volatility indicator helps display points where the price may be stretched. A great hint when trading the rising three methods is to see the pattern outside the lower bands and close inside them.
Ideal Settings: 20-period SMA, 2 standard deviations
(Learn To Trade And Read Candlestick Patterns Like A Pro)
What Are Similar Patterns To The Rising Three Methods Pattern?
Despite the advantages of the rising three methods, traders may want to find similar patterns for uptrend setups with greater frequency:
| Pattern Name | Description |
|---|---|
| Three white soldiers | – A bullish reversal or continuation pattern consisting of three consecutive strong bullish candles, each closing higher than the previous one. |
| Bullish harami | – A two-candle pattern where a small bullish candle follows a large bearish candle and stays within its body. It often signifies a reversal, but in an uptrend, it can also suggest consolidation and continuation. |
| Bullish flag | – A short-term consolidation after a strong upward price move, forming a parallel downward-sloping channel or rectangle, followed by a breakout to the upside. |
What Is The Opposite Pattern Of The Rising Three Methods?
The opposite of this pattern is the falling three methods. It’s a bearish continuation pattern that appears during a downtrend.
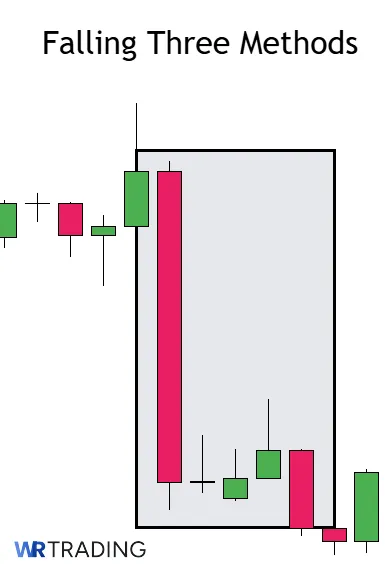
It begins with a long bearish candle, followed by three small bullish or neutral candles that stay within the range of the first, and ends with another strong bearish candle that closes below it. This formation signals a brief consolidation before the downtrend resumes with renewed selling pressure.
What Is The Difference Between The Rising Three Methods And The Falling Three Methods Pattern?
Let’s break down the differences between these two setups:
- The rising three methods is a bullish continuation pattern, while the falling three methods is a bearish continuation setup.
- In the rising pattern, the three small candles are bearish and occur within the range of a large bullish candle, signaling a pause before the uptrend resumes. Meanwhile, the three small candles are bullish with the falling pattern and appear within a large bearish candle’s range, indicating a short-term consolidation before further decline.
- Both patterns rely on volume and trend confirmation, but one implies buying momentum, and the other indicates selling pressure.
Here is a summary:
| Feature | Rising Three Methods | Falling Three Methods |
|---|---|---|
| Trend Direction | Bullish | Bearish |
| First Candle | Long bullish (green) | Long bearish (red) |
| Middle Candles (3) | Small bearish or neutral | Small bullish or neutral |
| Final Candle | Long bullish, breaks above | Long bearish, breaks below |
| Signal Type | Continuation of buying | Continuation of selling |
Learn Pattern Trading With The WR Trading Mentoring
Pattern trading is one of the key concepts taught at WR Trading. However, being a successful trader goes beyond mastering a few patterns. We mentor our traders to be smarter and more profitable traders while spending less time on the charts
Our mentorship includes:
- High risk-to-reward ratio trading strategies
- Clear, personalized trading plans
- Eliminating poor-quality trades
- Identifying the best, high-probability setups
We appeal to all experience levels of traders to improve their edge in forex and many other markets.
(Learn To Trade And Read Candlestick Patterns Like A Pro)
Conclusion: A Rare Gem in Trend Continuation Setups
The rising three methods is a rare yet effective technical analysis pattern with an above-average success rate. Unlike other setups, which may also be used in reversals, it primarily appears as a trend continuation setup. The formation’s structure exemplifies firm bullish strength following a brief pullback.
Trading the rising three methods successfully involves analysing the market context, adding as many confirmation layers as possible, and trading in a risk-conscious manner.
We believe it’s worth keeping the rising three methods in your back pocket while trading the more frequent alternatives. Either way, it’s a powerful setup on its own.