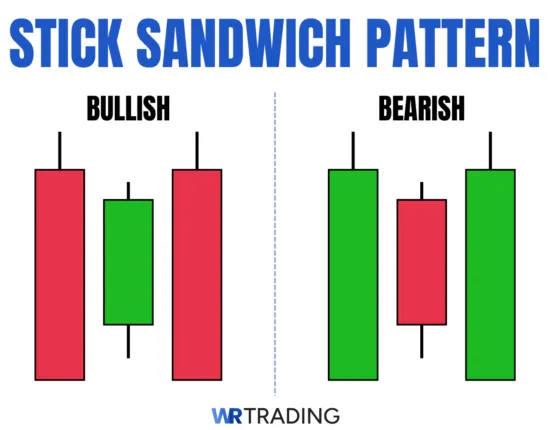
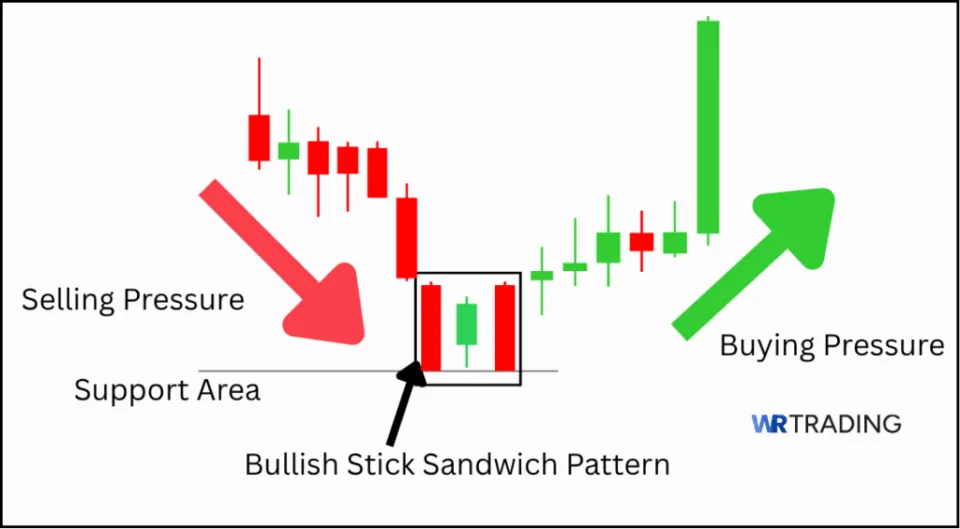
The Stick Sandwich is a rare three-candle reversal pattern that consists of a smaller middle candlestick bounded on the left and right by two opposing candlesticks that have a bigger range than the middle candle. What makes it unique is that the first and third candles close at or near the same price, creating a visual floor that reflects strong underlying support. Despite selling pressure, buyers step in and defend a specific price level twice.
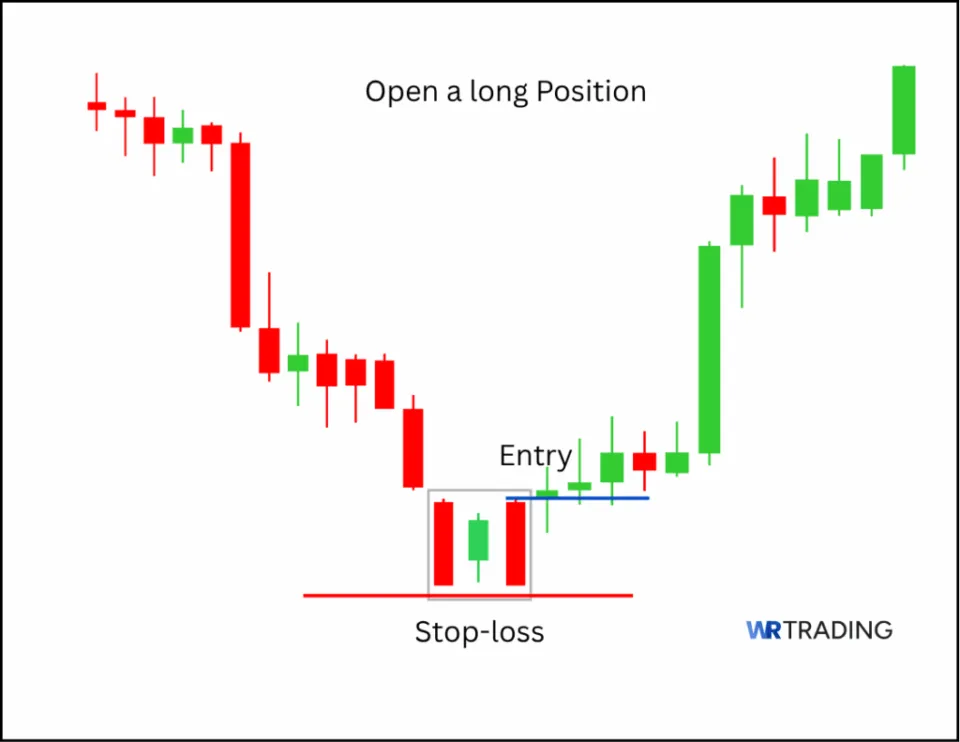
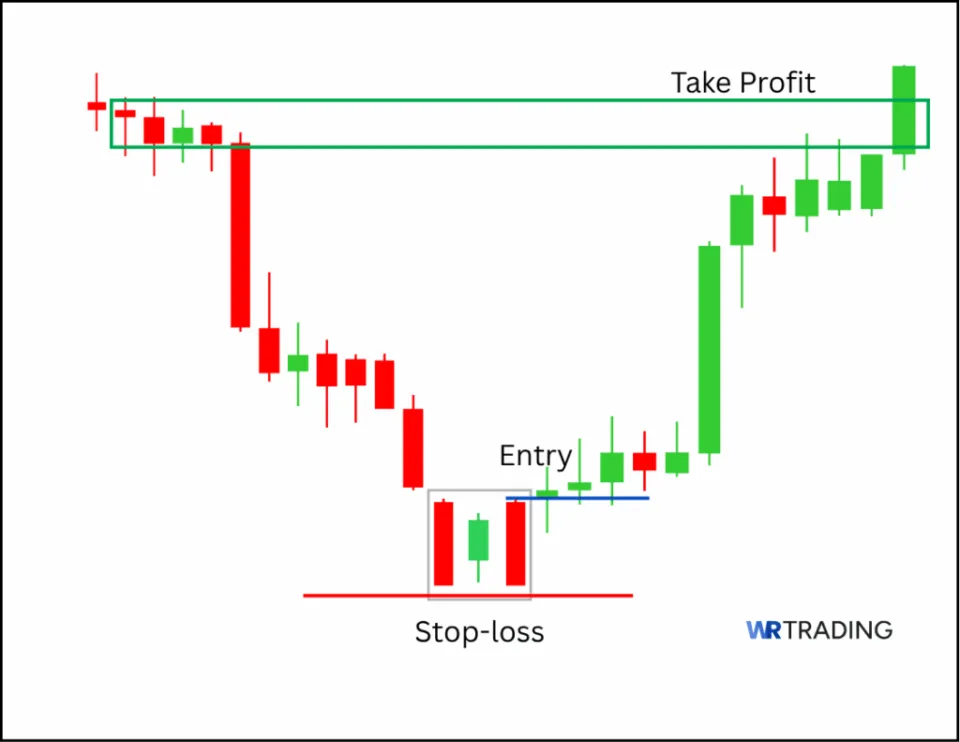
To trade the Stick Sandwich pattern, traders enter a long position (buy trade) above the high of the third candle, with a stop loss below the low of the pattern. By combining this pattern with disciplined risk management and market structure analysis, traders can increase their chances of success across forex, stocks, and the crypto market.
(Learn To Trade And Read Candlestick Patterns Like A Pro)
What Is a Bullish Stick Sandwich Pattern?
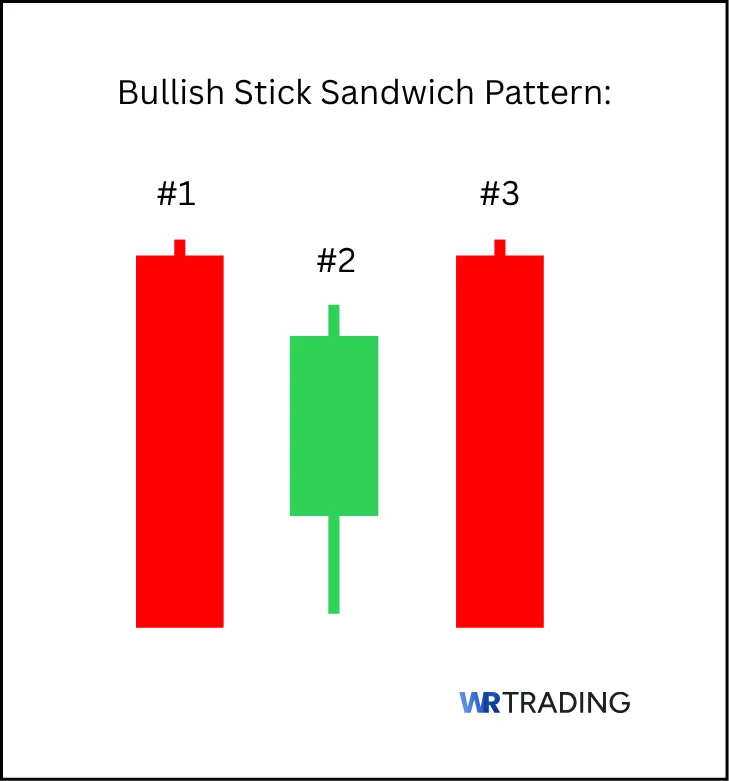
The Bullish Stick Sandwich is a three-candle bullish reversal pattern that forms in downtrend conditions. It starts with a long bearish candle, followed by a bullish candle that opens higher and closes lower, then ends with another bearish candle that closes at or near the close of the first candle. This final close near the same price level creates a “sandwich” effect, with the bullish candle in the middle.
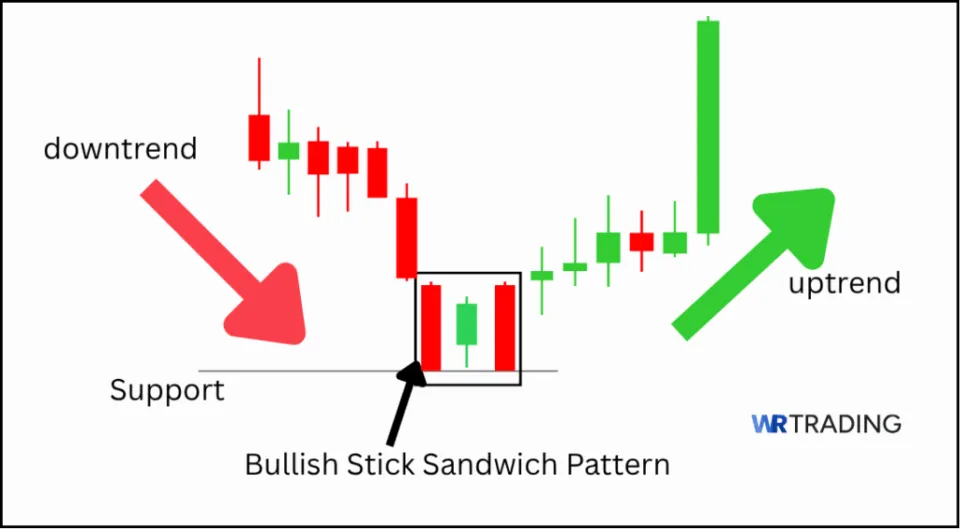
This setup signals a clear floor in price. Sellers attempt to drive the market lower but fail to break past support. The middle bullish candle indicates buyer interest, and the third bearish candle’s inability to push lower reinforces the strength of that level. Smart money often uses this area to trap shorts and prepare for a reversal.
Key Facts about how the Bullish Stick Sandwich Candlestick Pattern is formed:
- First Candle: Long bearish candle
- Second Candle: Short-range bullish candle
- Third Candle: Another long-range bearish candle
- Type of Pattern: Bullish Reversal
- Trend Prior to Pattern: Downtrend
- Opposite Pattern: Bearish Stick Sandwich Pattern
- Entry Options: Highest high of the pattern
- Stop-Loss Placement: the lowest low of the pattern.
- Interpretation: Both bearish candles being unable to break below the level of their close suggests that buyers are defending that level.
What Is a Bearish Stick Sandwich Pattern?
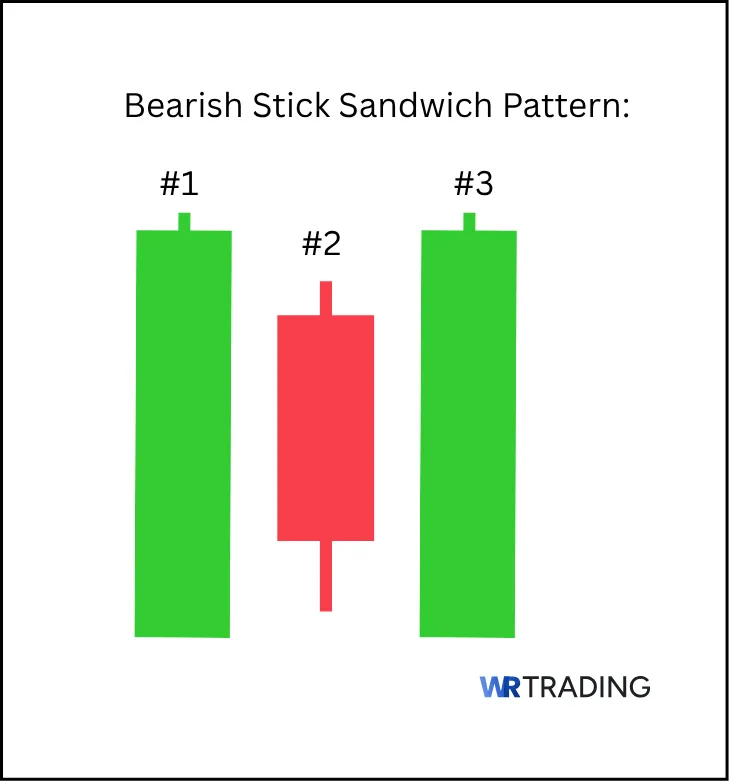
The Bearish Stick Sandwich is a three-candle bearish reversal pattern that shows up during an uptrend. It begins with a strong bullish candle, followed by a bearish candle that opens lower and closes higher than the last, and ends with another bullish candle that closes at or near the same price as the first.
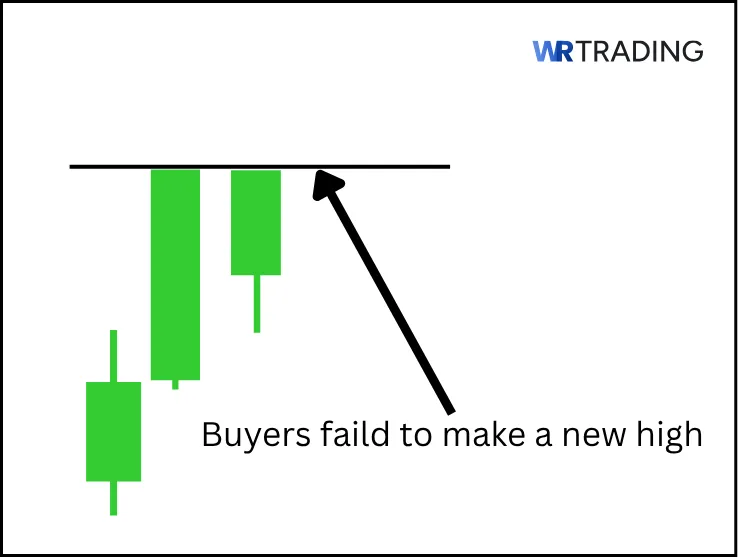
While the final candle appears bullish, it fails to break new ground. This failure suggests that sellers are stepping in and absorbing buying pressure. This indicates a possible exhaustion at resistance, warning that the trend might be reversing or pausing.
Key Facts about how the Bearish Stick Sandwich Candlestick Pattern is formed:
- First Candle: Long bullish candle
- Second Candle: Short-range bearish candle
- Third Candle: Another long-range bullish candle
- Type of Pattern: Bearish Reversal
- Trend Prior to Pattern: Uptrend
- Opposite Pattern: Bullish Stick Sandwich Pattern
- Entry Options: Lowest low of the pattern
- Stop-Loss Placement: the highest high of the pattern
- Interpretation: Both bullish candles being unable to break above the level of their close suggests that sellers are defending that level.
(Learn To Trade And Read Candlestick Patterns Like A Pro)
How Is The Stick Sandwich Pattern Formed?
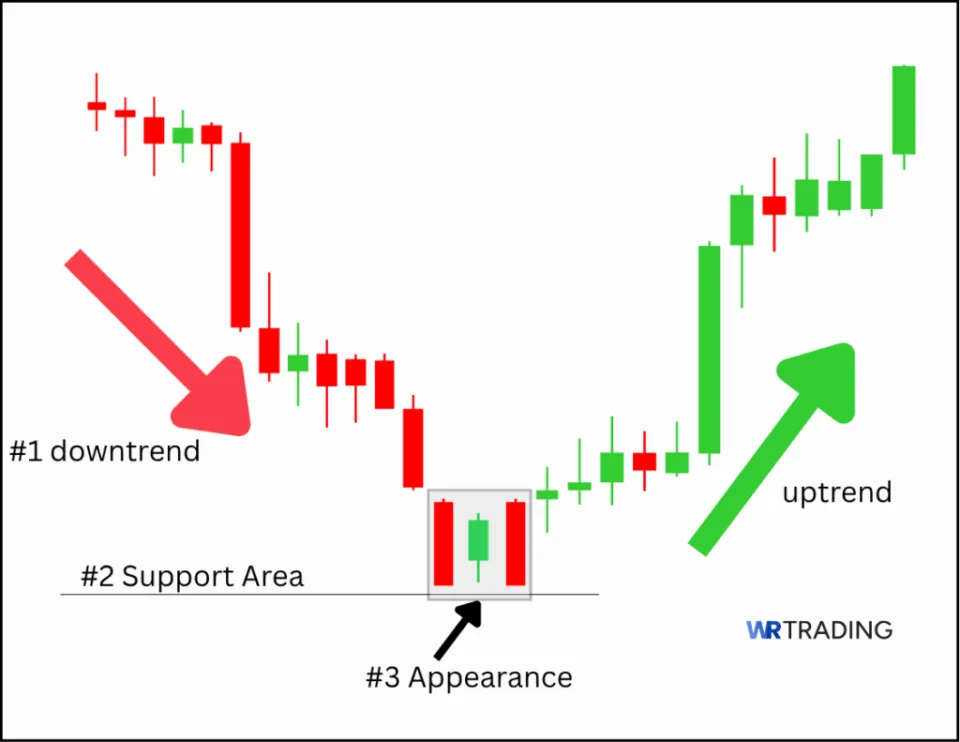
The Stick Sandwich pattern forms over three consecutive candles and is valid only when it appears within a clear trend. The setup reflects a pause in momentum followed by a retest of price levels that gets rejected.
For both variations:
- Candles before the pattern should reflect a clear directional trend
- Candles after the pattern may show reversal or follow-through, especially if supported by volume or key zones.
- It can appear on any chart, but is more reliable on 4H, Daily, or Weekly due to reduced noise.
What Does The Stick Sandwich Candlestick Pattern Mean?
The Stick Sandwich candlestick pattern reveals indecision and rejection within a trending market. It tells us that Price tried to break through a level twice and failed. This failure stems from the battle between buyers and sellers.
Psychologically, it means:
- Buyers see value or safety at a certain price
- Sellers lose momentum trying to force a breakout or breakdown
This pattern isn’t about random candles, it’s a fight for control at a key price. Whoever dominates that level usually shapes the next move.
Where Does the Name of The Pattern Stick Sandwich Come From?
The name comes from how it is visually structured, where the two candles with matching closes (the “bread”) surround a middle candle (the “filling”), creating a chart pattern that resembles a sandwich of price action.
(Learn To Trade And Read Candlestick Patterns Like A Pro)
What Is An Example Of The Stick Sandwich Pattern?
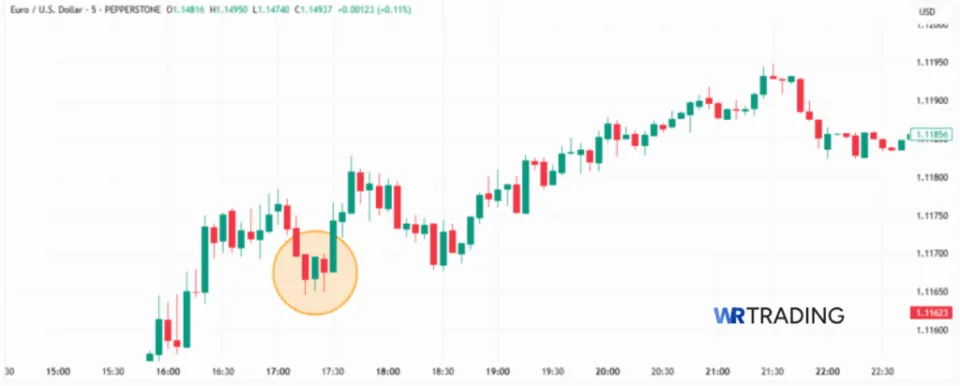
A clean bullish Stick Sandwich pattern occurred on the EUR/USD 5-minute chart on the 13th of May, 2025, during a short-term downtrend.
- First Candle (Bearish): Opened at 1.11699 and closed sharply lower at 1.11666, marking a strong sell-off.
- Second Candle (Bullish): Price opened at 1.11667, recovered during the session, and closed higher at 1.11696.
- Third Candle (Bearish): Opened at 1.11693, but reversed to 1.11676, nearly identical to the first candle’s close.
Despite another bearish candle, sellers failed to break below the original support level at 1.11666. These double-close characteristics formed the “bread” of the Stick Sandwich, and price rallied to 1.11948 over the next few sessions. This was a textbook reversal pattern.
How To Identify The Stick Sandwich Pattern
Spotting a Stick Sandwich pattern starts with scanning for clear directional trends. Focus on areas where price is testing support or resistance zones, especially after extended moves.
Here’s what to look for:
- Previous Candles: In a bullish pattern, expect at least two to three red candles showing consistent bearish momentum. In a bearish version, expect green candles in an uptrend.
- Pattern Formation: Look for a sequence of three candles.
- The first and third candles should be the same color and close at the same or nearly the same price.
- The middle candle should be the opposite color, with a range that sits between the first and third.
- Where to Search: key support or resistance levels; after sharp moves, where price is likely to pause or reverse
We use scanning tools and multi-timeframe technical analysis to isolate Stick Sandwich setups with high clarity and clean context.
How To Trade The Stick Sandwich Pattern
We trade this pattern in context. The Stick Sandwich can be a powerful reversal signal, but only when it aligns with key zones, structure, and confirmation signals. Here are the steps we use to turn the pattern into a valid trade:
- Find the right setup for the stick sandwich
- Wait For The Appearance Of The Stick Sandwich Candlestick Pattern
- Open Your Trade – Entry Point
- Wait For A Confirmation Or Not
- Choose Your Trading Take Profit
(Learn To Trade And Read Candlestick Patterns Like A Pro)
1. Find the Right Setup For The Stick Sandwich
We only trade this pattern when price is reacting off a key level. It must be either a well-tested support (for bullish setups) or a major resistance (for bearish setups). Without structure, the pattern means nothing. These are the setups we look for:
Bullish Stick Sandwich:
- Forms during a downtrend
- Appears near swing lows, demand zones, or Fibonacci levels (0.618, 0.786)
- Confluence with rising RSI divergence or volume spike
Bearish Stick Sandwich:
- Forms during an uptrend
- Appears near previous highs, supply zones, or EMA retests
- May align with a trendline rejection or a MACD bearish crossover
We always begin with structure before looking for candlestick patterns.
2. Wait For The Appearance Of The Stick Sandwich Candlestick Pattern
Once we’ve marked the zone, we wait for the pattern to form clearly. No early entries. All three candles must close before we consider a trade.
Here is a checklist for a valid pattern:
- Candles 1 and 3 must be the same color
- Candle 3 must close at or near the level of Candle 1
- Candle 2 must be the opposite color, forming the “filling.”
- The entire formation must appear in a logical zone
This setup is rare. When it forms correctly, we pay attention.
3. Open Your Trade: Entry Point
After confirmation or close of the third candle, we prepare the trade. Entry options vary based on your risk style. Risk styles are of two main types.
- Conservative: Wait for a follow-through candle (fourth candle) to confirm direction
- Aggressive: Enter on the close of the third candle if the pattern is strong and the context is clean
You can place your stop loss at these places:
- For a Bullish Setup: Below the low of the entire three-candle pattern
- For a Bearish Setup: Above the high of the three candles
We use fixed risk (1–2% of account balance).
4. Wait For A Confirmation Or Not
We don’t always require confirmation, but context decides. Use confirmation when the pattern forms in choppy markets, you’re trading lower timeframes (15m–1H), or when candle 2 shows long wicks or hesitation. Whenever the conditions are not ideal, we must use confirmation.
5. Choose Your Trading Take Profit
Our take-profit strategy is always based on market structure. We don’t set arbitrary targets. You can set your TP this way:
- TP1: Nearest swing high/low or price base or 1.618 Fibonacci extension
- TP2: Next swing high/low
- R:R Minimum: Always 1:2
- Optional: Use trailing stop once 1R is hit to lock in profits.
We don’t guess exits. We let price structure tell us where the market wants to go.
(Learn To Trade And Read Candlestick Patterns Like A Pro)
Which Strategies Can Be Used For The Stick Sandwich Candlestick Pattern?
A Stick Sandwich setup is only as powerful as the strategy behind it. Here are the top strategies we use to trade the Stick Sandwich with precision:
Support and Resistance Strategy
This is our core method. A Stick Sandwich gains validity only when it appears near a proven support or resistance level.
- Bullish pattern: Should form near major support, demand zones, or double bottoms
- Bearish pattern: Should appear near strong resistance, supply zones, or previous highs
We use price reactions, historical structure, and zone marking to filter clean entries. This strategy forms the foundation of every setup we take.
Volume-Based Strategy
Volume validates intent. Without it, candles are noise. For this strategy, we look for volume spikes. A decline in volume on the third candle suggests a false rejection and a surge in volume on the confirmation candle supports momentum. When a Stick Sandwich forms with increasing volume at a key level, we treat it as a priority trade.
Indicator Confluence Strategy
Indicators provide extra confirmation, but only when paired with context.
- RSI: We look for RSI divergence or a cross above 50 after a bullish Stick Sandwich
- MACD: A crossover in the direction of the setup supports trend reversal
- Moving Averages: Price reacting at the 20 or 50 EMA strengthens the zone
These tools don’t create trades, they support structure-based decisions.
Breakout Strategy
When the pattern appears near a range boundary, it often signals a pre-breakout shift.
- For Bullish Setups: Wait for a break above the second candle’s high
- For Bearish Setups: Look for a drop below the second candle’s low
These strategies filter risk and improve accuracy. When they align with the Stick Sandwich pattern, we enter with full confidence because the entire setup makes sense.
What Is The Success Rate Of The Stick Sandwich Candlestick Pattern?
The Stick Sandwich candlestick pattern has a historical success rate between 62% and 67%, depending on the market, timeframe, and how well it’s filtered. Patterns with symmetry and identical closes tend to perform better when traded with structure and confirmation.
In our logs, we found that:
- Bullish Stick Sandwich setups hit TP 67% of the time
- Bearish Stick Sandwich setups also hit TP 67% of the time.
- Patterns with structure combination and confirmation indicators had a win rate over 60%
However, the pattern loses accuracy when traded in low-volume zones or without confirmation.
Several key factors can influence the hit rate of the Stick Sandwich pattern. First is the structure. The pattern becomes more reliable when it forms near clear support or resistance levels or lines up with Fibonacci retracement points.
Second is volume, which adds strength. Strong volume on the second or third candle increases conviction in the setup. Finally, using tools like RSI, MACD, or a trendline break can improve the outcome by confirming both momentum and direction.
Is the Stick Sandwich Candlestick Pattern Suitable For Beginners?
Yes, the Stick Sandwich pattern is suitable for beginners if taught correctly. The structure is clear and easy to recognize: three candles, with the first and third closing at the same level, and the second candle opposite in direction. This makes it visually simple, which helps new traders build confidence.
(Learn To Trade And Read Candlestick Patterns Like A Pro)
What Are The Pros And Cons Of the Stick Sandwich Pattern?
Pros
- It is easy to spot on the chart
- It signals clear support or resistance rejection.
- It works well on higher timeframes
- It pairs cleanly with indicator confirmation.
- It can catch early trend reversals.
Cons
- It is often easily misread by beginners
- It requires a strong context to work.
- It can fail in a ranging or sideways market.
- It needs confirmation for consistency.
- It is not frequent.
What Are The Advantages Of The Stick Sandwich Pattern?
Let us explore the pros in detail:
- Easy to Spot on the Chart: The pattern has a simple three-candle structure. Traders can scan charts and quickly recognize them without ambiguity, which makes it ideal for systematic scanning.
- Signals Clear Support or Resistance Rejection: This pattern repeatedly rejects the same level, thereby strengthening our conviction.
- Works Well on Higher Timeframes: On the 4H, Daily, or Weekly charts, the Stick Sandwich produces clearer setups with reduced noise. These timeframes allow price structure to build properly and give cleaner signals.
- Pairs Cleanly With Indicator Confirmation: MACD, RSI, volume, and other indicators all sync well with this setup. When a Stick Sandwich pattern forms with one or more indicators in agreement with the move, we consider it a high-probability entry.
- Helps Define Stop-Loss and Take-Profit Zones: Since the first and third candles close at the same level, without hesitation, we can use the stop level to define our risk with precision, and as a result, our targets.
What Are The Disadvantages Of The Stick Sandwich Pattern?
Despite its strengths, the Stick Sandwich is not a plug-and-play pattern. It has limits and blind spots that new traders must be aware of.
- Misread Often by Beginners: Because of the middle candle, beginners often think the pattern is still trending, instead of reversing. This misinterpretation leads to bad entries or late exits.
- Requires a Strong Context to Work: Without clean support or resistance zones, the pattern loses meaning. The surroundings matter more than the candles.
- Can Fail in Ranging or Sideways Markets: Stick Sandwich patterns don’t work well in choppy price action. They need trend exhaustion and structure to create an edge. In consolidation, it’s just noise.
- Needs Confirmation For Consistency: While it can work without it, most clean trades come with follow-through candles or supporting indicator signals. Entering without confirmation is riskier.
- Rare Pattern: This isn’t a pattern you’ll see every day. It doesn’t form often, thereby limiting how frequently it can be used in your strategy.
Can The Stick Sandwich Have Failure Signals?
Yes, the Stick Sandwich pattern can fail. Failure risk increases when:
- The pattern forms in a range-bound or indecisive market
- There’s no volume confirming the price rejection.
- The middle candle closes too aggressively, indicating true momentum.
- A false breakout traps traders and price reverses back through the zone
- The pattern appears mid-trend, not at an exhaustion point.
In our experience, traders who rely purely on the pattern without a backing structure or supporting signals are more likely to be stopped out.
Which Indicators Can Be Combined With The Stick Sandwich to Increase Its Success?
Combining the Stick Sandwich pattern with indicators makes it more accurate. These are the indicators we use in our playbook:
| Indicator | Settings | How to Use It with the Stick Sandwich Pattern |
|---|---|---|
| RSI | 14-period | Look for RSI divergence from price near support or resistance. A break above 50 signals bullish momentum; a break below 50 confirms bearish setups. |
| MACD | 12, 26, 9 | Use a crossover in the direction of the pattern to confirm momentum. Shrinking histogram bars before the pattern signal weakening of the current trend. |
| Volume | Session or Candle Volume | A volume spike in the middle or confirmation candle shows real interest from buyers or sellers. Low volume during the pattern increases the risk of a fake signal. |
| Fibonacci Retracement | 0.382 / 0.618 / 0.786 | When the pattern forms near one of these levels, it adds structural support to the trade idea and improves alignment with broader market movement. |
These indicators don’t replace the pattern, they simply enhance its context.
(Learn To Trade And Read Candlestick Patterns Like A Pro)
What Are Similar Patterns To The Stick Sandwich Pattern?
Several candlestick patterns share the psychological structure and reversal logic of the Stick Sandwich. These alternatives may differ in appearance, but they carry similar implications. Here are some patterns with similar forecasts:
- Matching Low (Bullish Reversal): Two bearish candles that close at the same price. Suggests support is holding firmly. Similar to a bullish Stick Sandwich but with two candles only.
- Matching High (Bearish Reversal): Two bullish candles with identical closing prices. It signals resistance, rejection, and is visually simpler than the bearish Stick Sandwich.
- Dark Cloud Cover: This is a bearish reversal pattern. The second candle opens above the first and closes below its midpoint. It often follows strong bullish trends.
- Morning Star: A three-candle bullish reversal setup where the middle candle is a small-bodied indecision candle. It signals a momentary pause and potential reversal.
- Evening Star: It is the bearish counterpart to the Morning Star. Signals a shift from bullish momentum to potential downside.
See more similar Patterns to the Stick Sandwich in our free WR Trading Candlestick Bible PDF.
What Is The Opposite Pattern Of The Stick Sandwich?
The opposite of the Stick Sandwich pattern in terms of candles is the Matching High (for bullish Stick Sandwich) or Matching Low (for bearish Stick Sandwich). In both cases, while the stick sandwich pattern is a 3-candlestick formation, the matching candlestick pattern is a 2-candlestick formation.
What Is The Difference Between The Bearish Stick Sandwich And The Matching High Pattern?
The Stick Sandwich offers more confirmation through price retest, while the Matching High relies on immediate resistance. While both patterns signify a potential bearish reversal, their construction and context are different.
A Bearish Stick Sandwich is a three-candle pattern where the first and third candles are bullish and close at the same level, with a bearish candle in the middle. It typically forms after an uptrend and suggests exhaustion.
The Matching High pattern, however, is a two-candle structure where both candles close at the same high. It’s simpler and faster to form but carries less structural depth than the Stick Sandwich.
What Is The Difference Between The Bullish Stick Sandwich And The Matching Low Pattern?
While both patterns aim to forecast a bounce, the Stick Sandwich shows more buyer interest through the middle candle and offers a stronger psychological signal of reversal.
The Bullish Stick Sandwich involves three candles: two bearish candles on either side of a bullish one, with the first and third closing at the same price. It shows sellers failing twice at the same level, which strengthens the bullish case.
In contrast, the Matching Low consists of two bearish candles that close at the same price. It indicates support, but without the middle bullish reaction seen in the Stick Sandwich.
What Are The Limitations Of The Stick Sandwich Pattern?
Despite its strengths, this pattern has clear limitations that traders must respect:
- Needs Trend Context: The pattern doesn’t work well in sideways markets or during consolidation.
- Low Frequency: It is not ideal for high-frequency trading methods.
- Confirmation Dependent: Without follow-through, the pattern may produce false signals.
- Susceptible to News Volatility: High-impact news can invalidate even the cleanest pattern setups.
- Timeframe Sensitive: The pattern works best on higher timeframes and is unreliable on low timeframes due to noise.
Learn Pattern Trading With The WR Trading Mentoring
At WR Trading, we teach real-world execution. Our mentoring program trains traders to spot candlestick patterns like the Stick Sandwich within a complete market context. Inside our private mentoring group, we break down real trades in live sessions. Our goal is to give you a repeatable system that works.
Whether you’re just starting or refining your edge, we give you the strategy, tools, and mindset to trade with structure, not guesswork.
(Learn To Trade And Read Candlestick Patterns Like A Pro)
Conclusion: Trade the Stick Sandwich With Context
The Stick Sandwich candlestick pattern is a visually simple, high-insight structure that reveals a crucial shift in market sentiment. To trade the Stick Sandwich pattern effectively, enter a long position (buy trade) above the high of the third candle, with a stop loss below the low of the pattern to manage risk.
Look for confirmation from indicators like RSI or MACD, and ensure the market structure supports a potential reversal. We do not recommend using this pattern on lower timeframes, in sideways markets, or during news volatility. That’s where it loses edge and becomes noise.
By mastering the Stick Sandwich pattern and combining it with a deep understanding of market dynamics, traders can trade with confidence and precision. Trade the story behind the candles, and let the market’s narrative guide your decisions.