The overall best stock market scanners for day trading are InvestingPro, Finviz, and Koyfin. In this guide, we compiled our top stock scanners for filtering market noise and spotting hidden intraday trading opportunities in the stock market. As veteran traders at WR Trading with decades of cumulative trading experience, we have first-hand experience with both great and terrible stock scanners. The thing is, it is not enough to have the most filters and screening options to become a “great” scanner. In fact, there are so many paid stock scanners that perform worse than the free versions of the scanning software we have in this list.
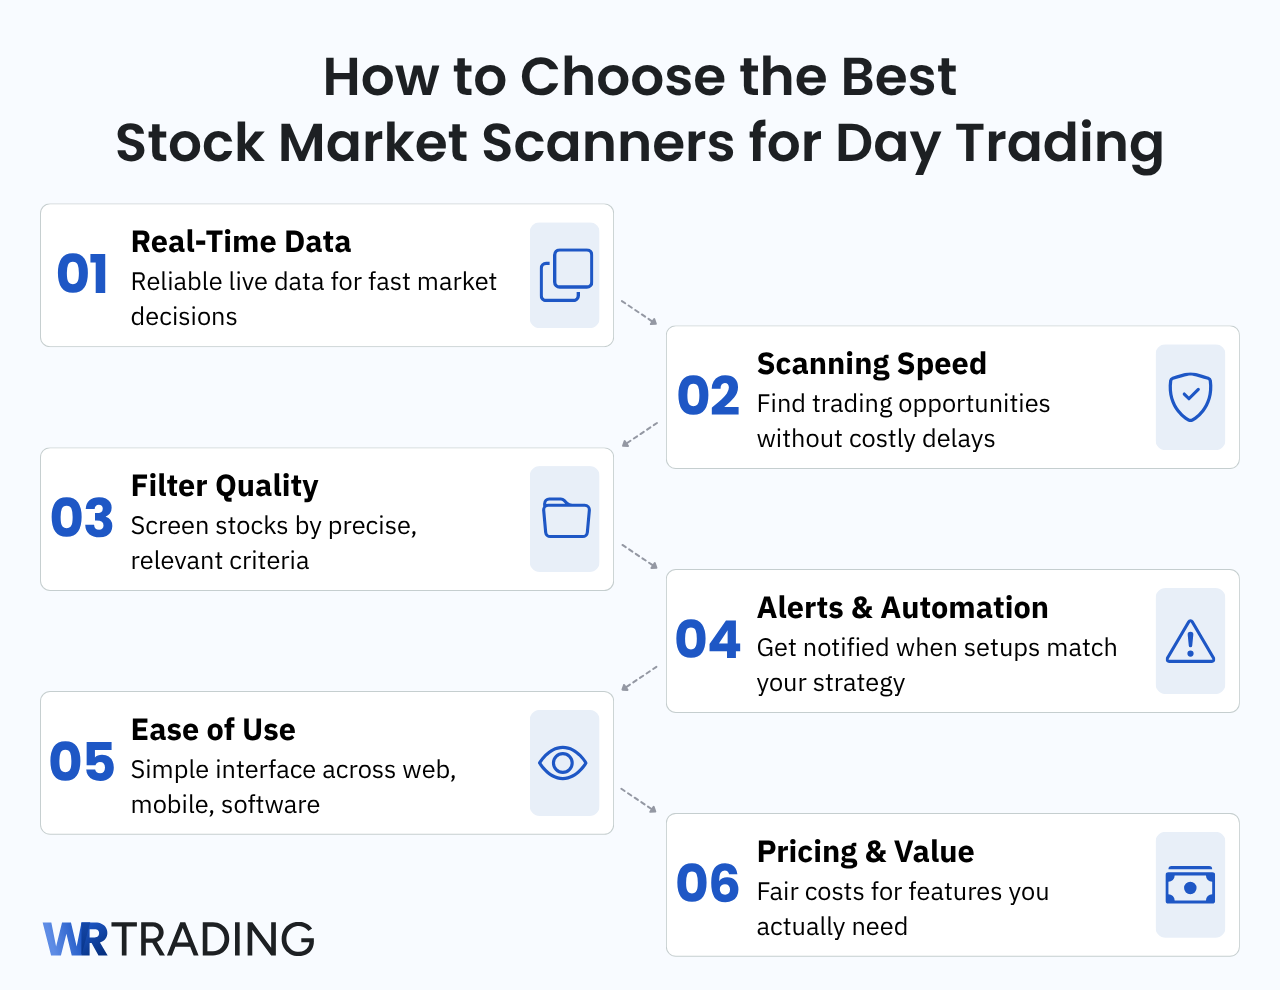
In our experience, there are 6 key factors that you should consider when choosing a stock scanner, namely:
- the reliability of real-time data they produce,
- how fast and responsive its scanning process is,
- the quality and depth of its screening filters,
- how good its alerts and automation is,
- its ease of use and user interface, and
- its pricing and if it is really worth your money.
The 8 Best Stock Market Scanners In Comparison
Looking at these factors, we selected the top 8 stock scanners based on our own independent testing and review process. Here’s a snapshot for you to explore and compare the best stock scanners for day trading (with their highlight features):
| Stock Scanners | Key Features |
|---|---|
| InvestingPro | Our Take: The best overall stock screener for day trading Highlight Features: Covers 72,000+ global stocks, ETFs, and indicesAI analysis with entry, exit, and probability assessmentFeature-rich considering its affordable paid plans |
| Finviz | Our Take: The easiest pure stock screener for US instruments Highlight Features: One of the easiest pure stock screeners we testedStrong alert system for news, insider trading, and SEC filingsWith simple yet very useful free version |
| Koyfin | Our Take: The best global market screener for advanced traders Highlight Features: Covers over 100,000 global equities, ETFs, and indicesSolid range of charting and watchlist toolsGreat for advanced traders who want a modern, professional, and data-heavy market scanner |
| Seeking Alpha | Our Take: The best research-driven stock screener for US instruments Highlight Features: Best-in-class research-driven alertsReliable and fast real-time US market dataAvailable on web, iOS app, and Android app |
| Trade Ideas | Our Take: The best professional scanner for active US and Canadian stock traders Highlight Features: One of our top choices for those looking to focus in US and/or Canadian instrumentsWith a strong suite of 500+ alerts and filtersWith strong support for pre-market and after-hours data |
| Trend Spider | Our Take: The best scanner for those who want advanced automation Highlight Features: Strong automation offerings, including dynamic alerts, multi-factor alerts, cloud alerts, webhook alerts, and scheduled scannersSupports trading bots, Strategy Bots, AI alert/scanner creation, and SignalStack-based order automationAvailable on web browser, iOS, Android, and Chrome extension |
| TC 2000 | Our Take: The best classic scanner for experienced day traders Highlight Features: Strong charting and watchlist tools, including customizable layouts and multi-monitor supportIts Premium+ supports 1,000 real-time customizable alerts, Market Pulse gauges, and live auto refreshing filters and sortsAvailable across many platforms, including Windows desktop, web, Mac, iPhone, iPad, Android, Chromebook, and Kindle Fire |
| TradingView | Our Take: The best free day trading scanner Highlight Features: In our opinion, it has the best free version among all the scanners in this listA wide coverage of global stocks, indices, and ETFs across 150+ exchanges from 50+ countriesExcellent charting tools, which many traders already use as their default charting platform |
1. InvestingPro
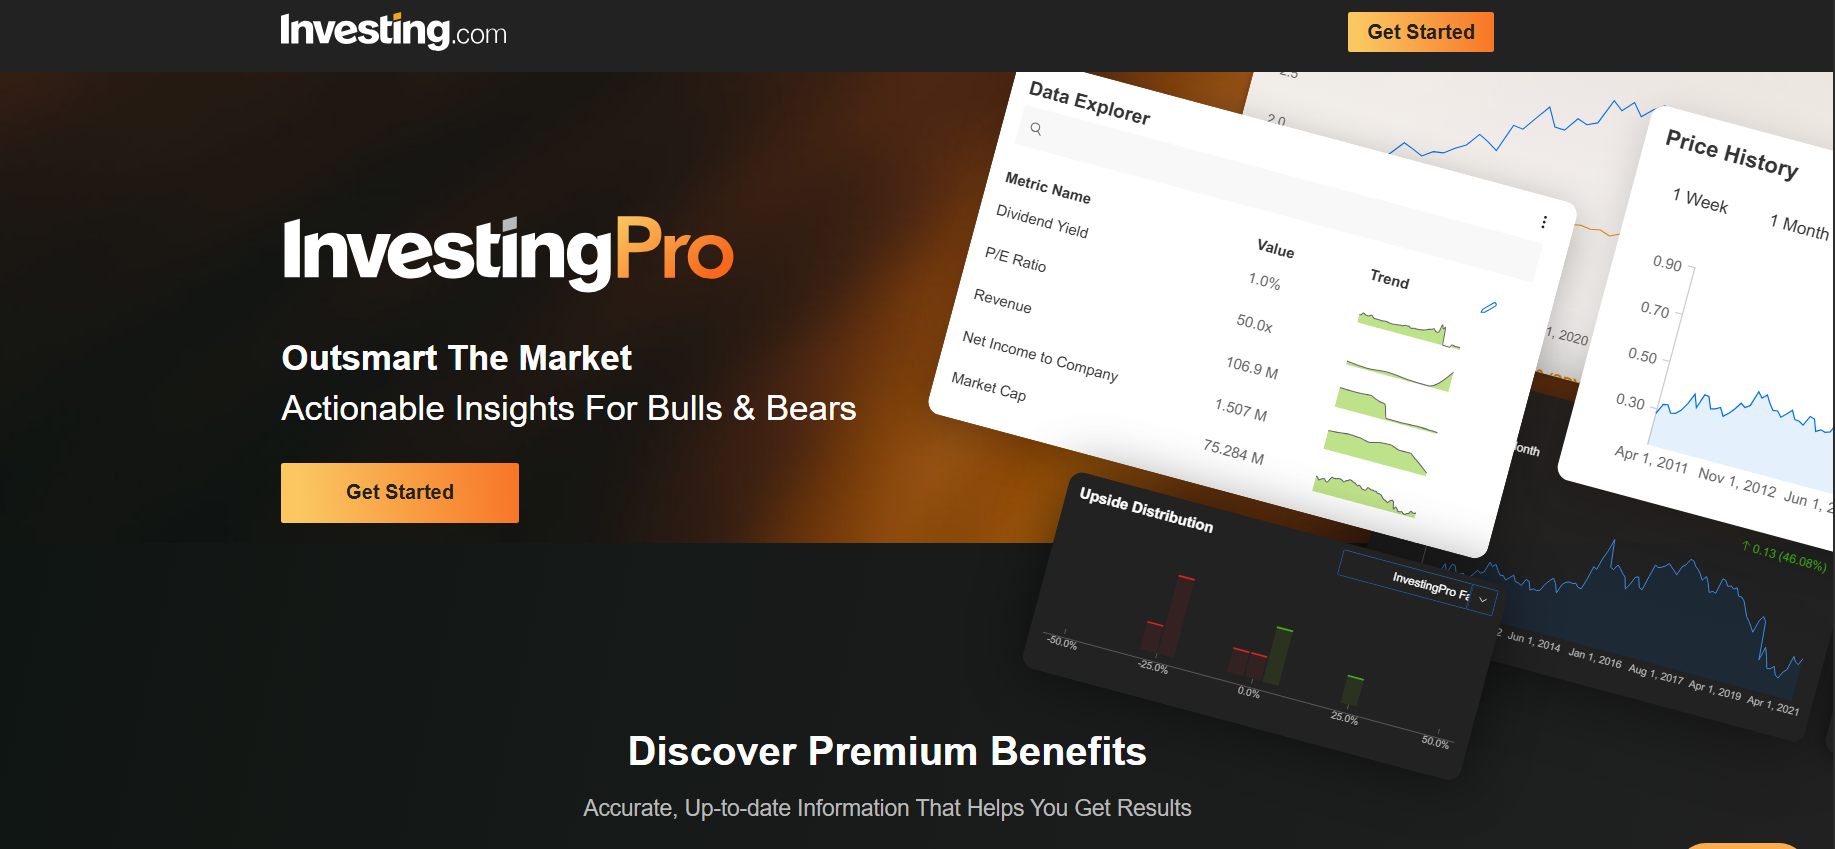
We ranked InvestingPro as the best screener for day traders because it performed very strongly across the six key factors we considered: real-time data reliability, scanning speed, filter depth, alerts and automation, ease of use, and overall value for money. For its affordable price, we are very impressed with how it covers a massive range of 72,000 global stocks, ETFs and indices with real-time data availability, strong alerts, AI analysis, backtesting, and a relatively user-friendly interface. Lastly, for its plans’ price, we genuinely think it is one of the most complete scanner setups you can get.
Key Pros:
- the best value for money (considering its affordable prices for the level of features it offers)
- Fast and reliable scanning process
- Strong real-time data availability across global stocks, ETFs and indices
Key Cons:
- No free version
- No dedicated desktop software
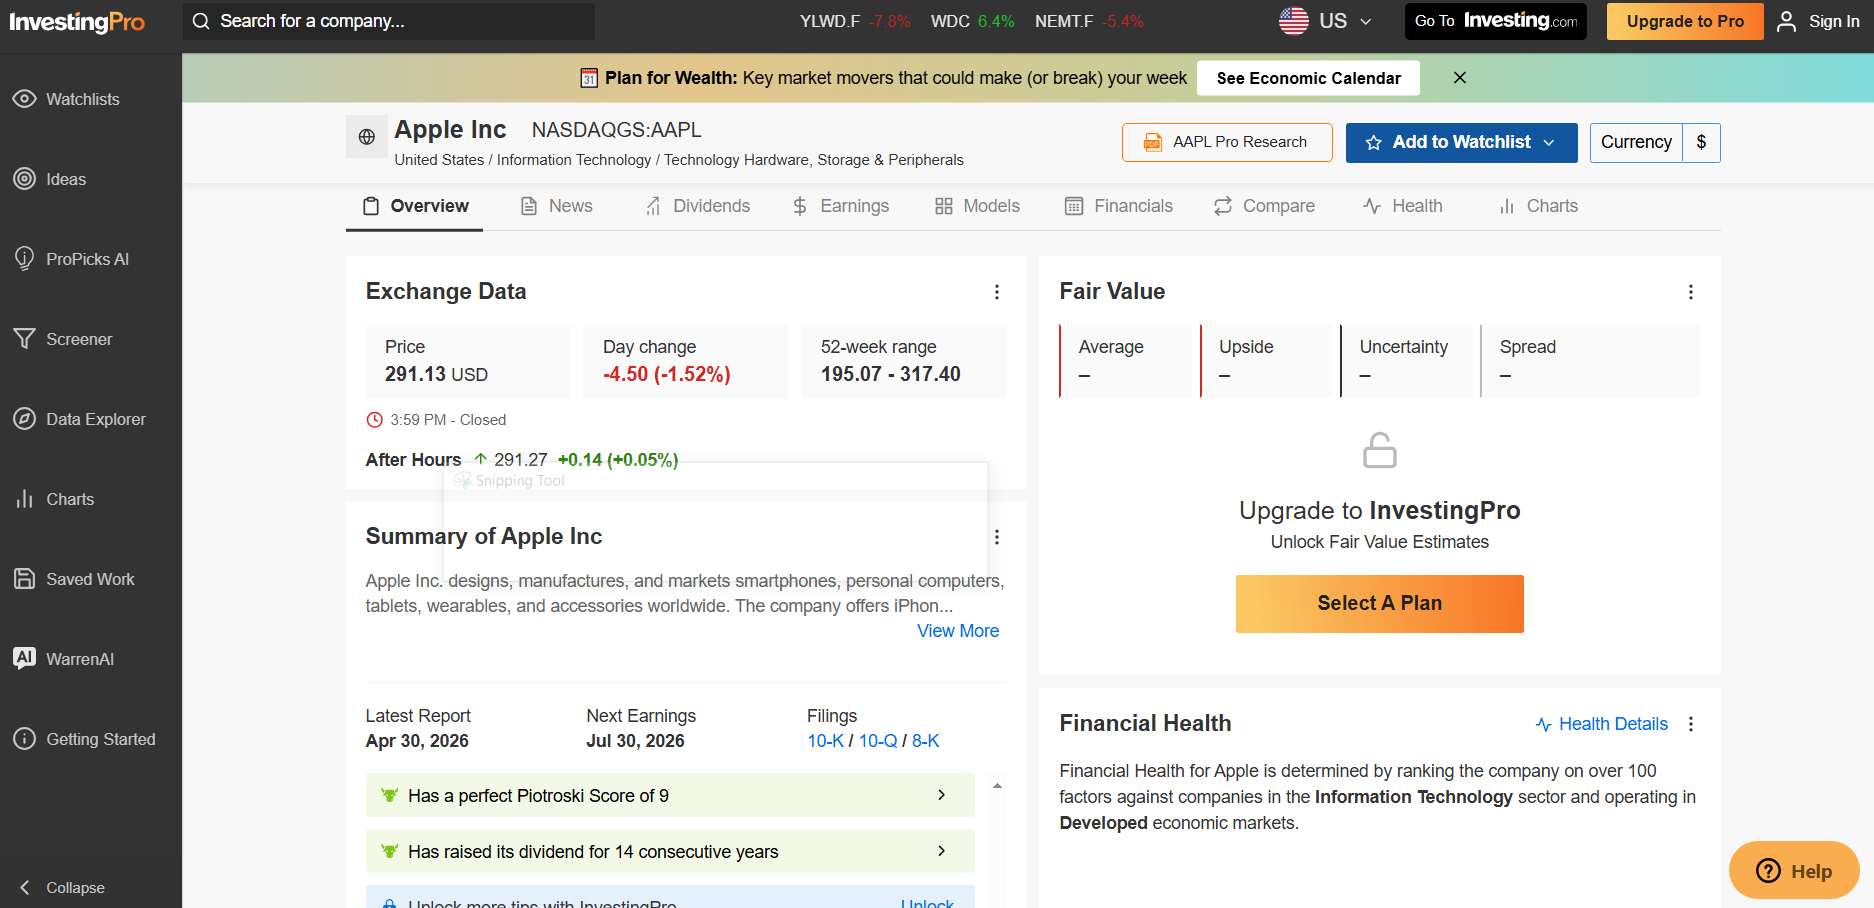
One of the best ways to use InvestingPro for day trading is to utilize its advanced stock screener to filter instruments by price movement, percentage change, volume, earnings activity, and market events, then move the strongest names into a focused watchlist (this is personally what we do, too). From there, its real-time updates, alerts, AI analysis, and customizable dashboard can help you have overall clean trade setups (as long as it complements your strategy).
Here’s our comprehensive breakdown of InvestingPro’s key specifications and features:
| Specifications & Features | Details |
|---|---|
| Free Version | None |
| Paid Version Cost | Investing Pro: starts at $14.99/month or $179.99/year Investing Pro+: starts at $37.49/month or $449.99/year *prices vary depending on your country/region and seasonal promotional discounts may apply |
| Markets Covered | Over 72,000 global stocks, ETFs and indices |
| Backtesting | Available for paid versions |
| Available Platforms | Web, iOS app, and Android app |
| Real-Time Data Availability | Investing Pro: Real-time updates available, with official stock data coverage of 72,000+ stocks worldwide Investing Pro+: Real-time updates available, with deeper Pro+ data access, advanced metrics, and up to 10 years of financial data |
| Charting and Watchlists | Investing Pro: AI-driven chart overview and analysis, customizable watchlists, real-time watchlist updates, price alerts, and Fair Value tracking Investing Pro+: Same as Investing Pro, plus deeper data access, exportable historical data, customizable metric view, and more advanced analysis tools |
| Customizable Dashboard | Yes; for both Investing Pro and Investing Pro+ |
| Our User Friendliness Rating | 4.7/5; very user-friendly and intuitive based on our own independent testing |
For Alerts and Automation you can use following Features:
- Investing Pro: Instrument alerts for price movement, percentage change, earnings results, volume; economic event alerts with recurring reminders; earnings release alerts; author alerts; news and analysis notifications; watchlist notifications for performers and top movers; unlimited custom price alerts; Fair Value tracking through Advanced Watchlist; AI analysis that generates entry/exit, and probability assessment
- Investing Pro+: everything on Investing Pro, plusmore AI and research capacity, advanced stock screener, access to all 88 ProPicks AI strategies, earnings and dividend widgets, fundamentals charts and metrics, customizable metric views, export for offline work, 10-year financial history, 14+ financial models.
2. Finviz
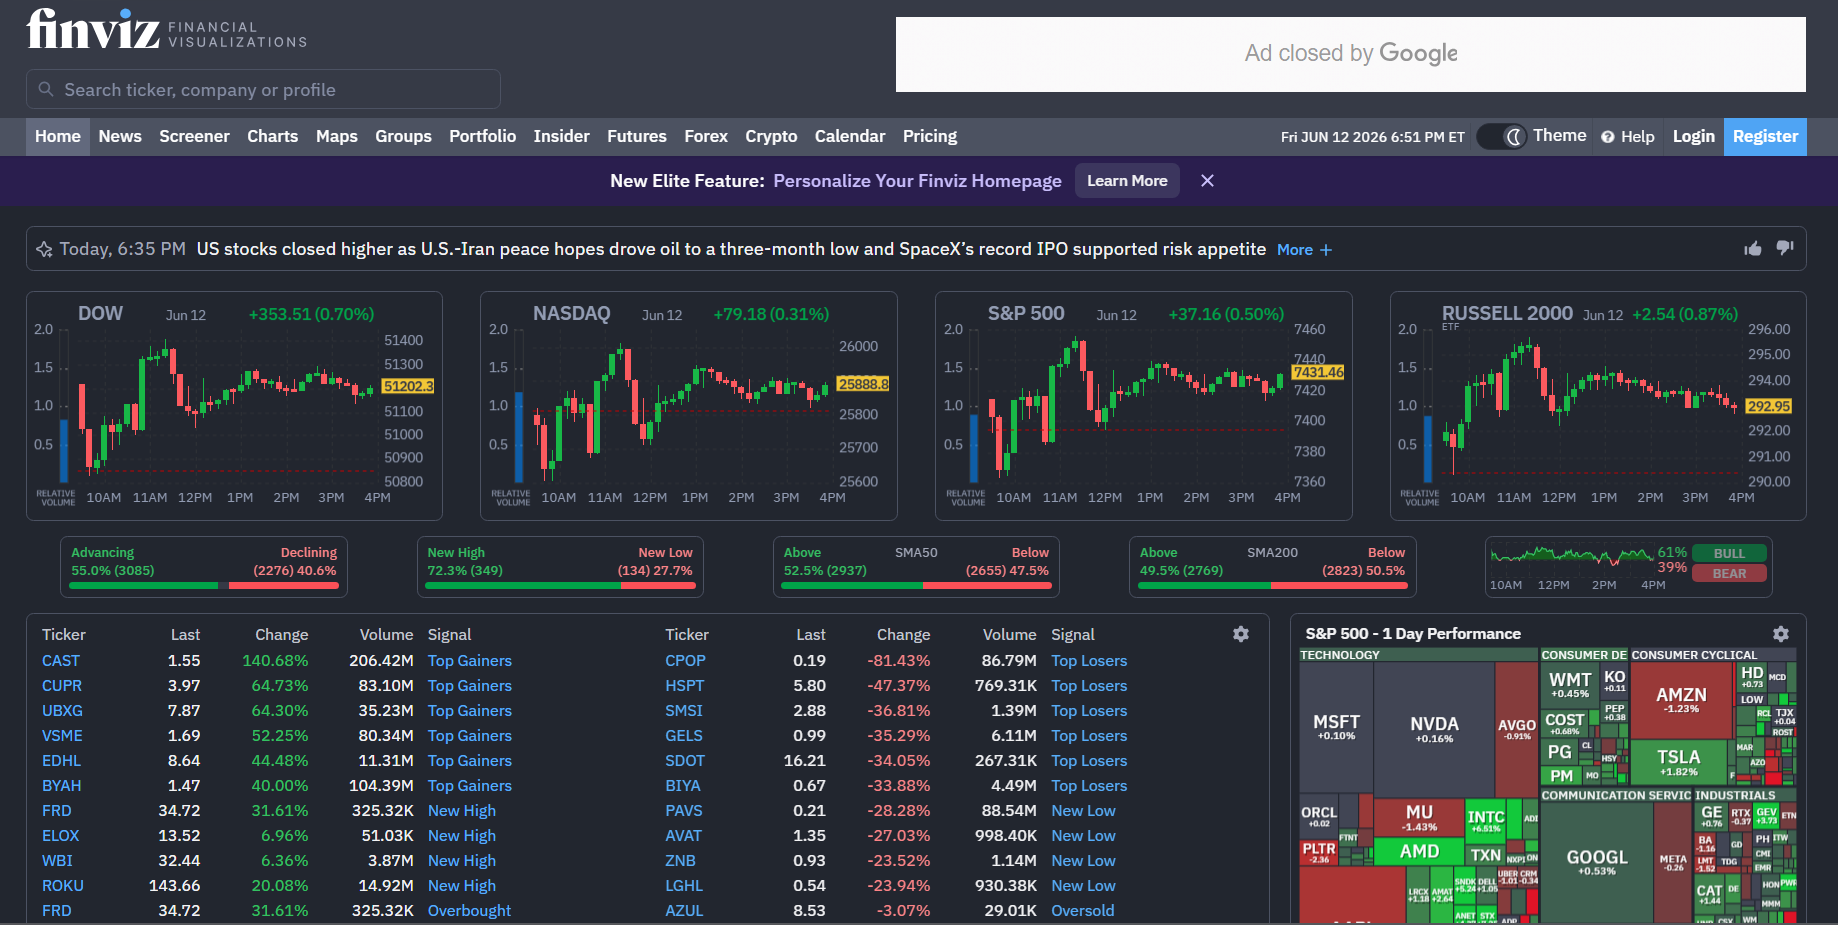
Our second place is Finviz. We really like Finviz because it is one of the cleanest and easiest pure stock screeners for US stocks, indices, and ETFs we have used. While it is not the most advanced scanner in this list, its free version, simple interface, screener alerts, intraday charts, and a notable user-friendly interface make it a very practical choice for traders who want a fast and “no nonsense” scanning setup (we also think it’s great for total beginners, too!).
Key Pros:
- With a simple yet useful free version
- One of the easiest pure stock screeners we have used
- Strong alert system for news, insider trading, and SEC filings
Key Cons:
- Market coverage is focused only on US stocks, indices, and ETFs
- Web browser only, so there is no dedicated desktop or mobile app listed
The best way we found to use Finviz for day trading is to take advantage of its stock screener and filter instruments within the US market, then save your best filters so Finviz Elite can notify you when new stocks match your specific setup. From there, its real-time quotes, intraday charts, portfolio notifications, and auto pattern recognition can really help you build a cleaner watchlist before deciding which stocks are actually worth trading (though we highly recommend waiting for a valid confirmation first).
Here’s our comprehensive breakdown of Finviz’s key specifications and features:
| Specifications & Features | Details |
|---|---|
| Free Version | Available |
| Paid Version Cost | Finviz Elite: Starts at $39.50 (monthly plan); $24.96/month (annual plan)*seasonal promotional discounts may apply |
| Markets Covered | US stocks, indices and ETFs |
| Backtesting | Available for paid versions |
| Available Platforms | Web browser only |
| Real-Time Data Availability | Real-time US stock, indices, and ETF quotes |
| Charting and Watchlists | Interactive multi-layout charts, intraday charts, auto pattern recognition, chart previews for watchlisted tickers, up to 100 portfolios |
| Customizable Dashboard | Yes; available on the Elite plan |
| Our User Friendliness Rating | 4.6/5; In our experience, this is one of the easiest pure stock screener that we have used |
Finviz Elite: Unlimited email alerts and push notifications for: price movements,insider trading, ratings, news, and SEC filingsportfolio notificationsscreener notifications when new stocks match saved filters; unlimited one-click chart price alerts; export/API access for Screener filters
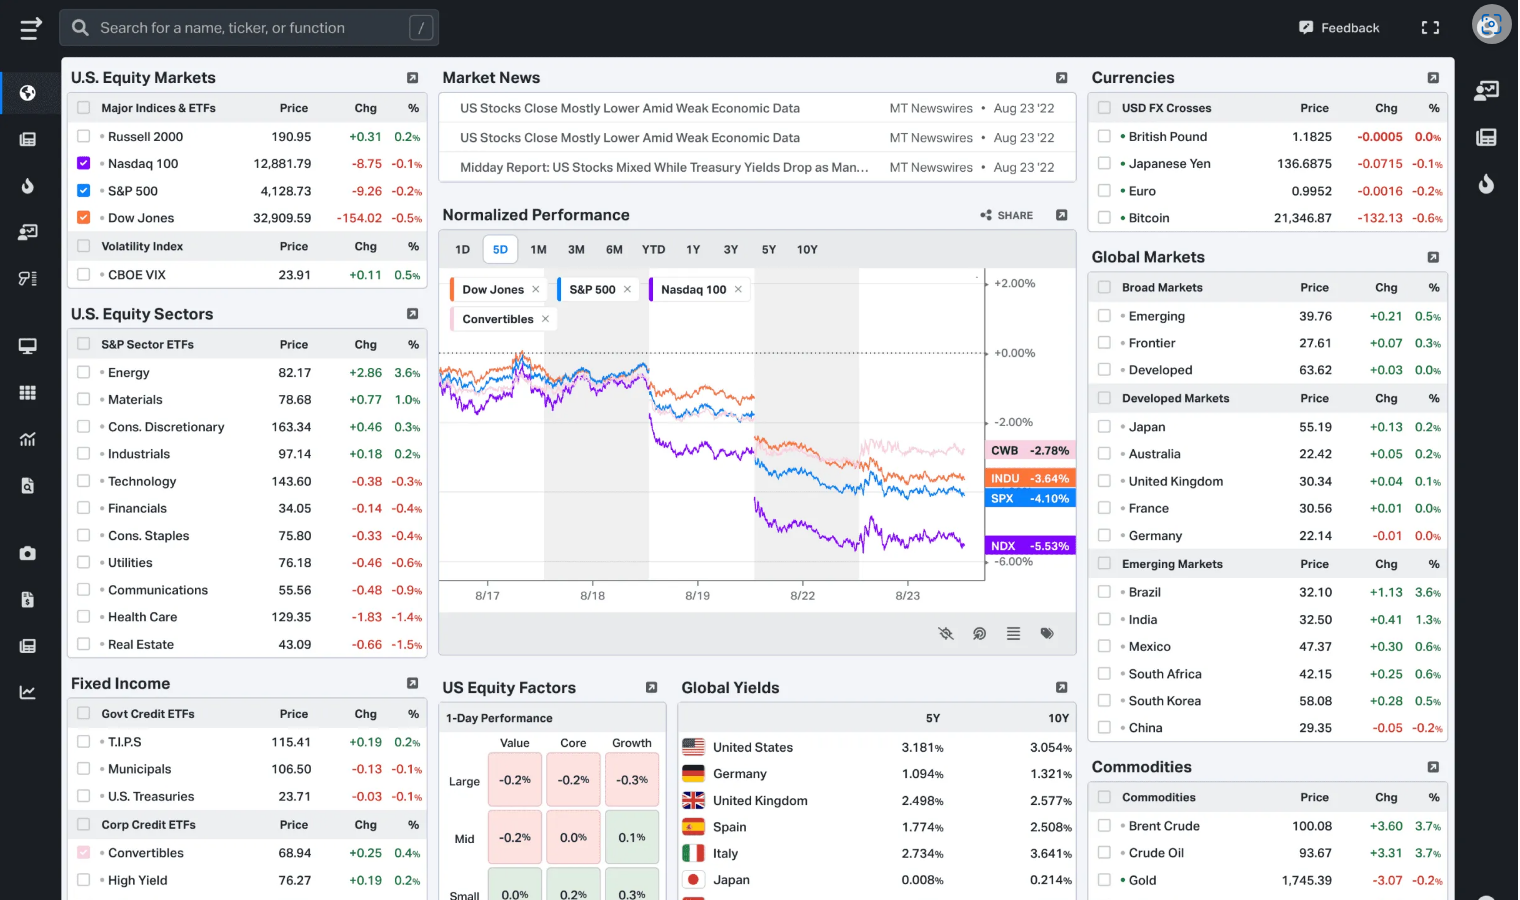
3. Koyfin
Our top 3 is Koyfin because during our testing, we experienced first-hand how it gives advanced traders (such as traders like us in WR Trading) one of the broadest market screening range in any stock screener we’ve used, with an impressive coverage of over 100,000 global equities, ETFs, and indices. While it is not the simplest or cheapest scanner, if you want a more professional, data-heavy platform with advanced charting, custom watchlists and dashboards, alerts, and capable backtesting, Koyfin is a very strong choice that we highly recommend.
Key Pros:
- Covers over 100,000 global equities, ETFs, and indices
- Solid range of charting and watchlist tools
- Great for advanced traders who want a modern, professional, and data-heavy market scanner
Key Cons:
- More expensive than many other scanners (especially once you move beyond the Plus plan)
- Not the most beginner-friendly scanner based on my testing and review (it’s data-heavy)
For active day trading, make the most out of its stock screener and filter instruments across its wide global market coverage, then organize the best names into custom watchlists and dashboards. This is how we would do it. Also, we recommend focusing mainly on its technical signal alerts, valuation alerts, and advanced charting tools as these can give you a real trading edge when mastered.
Here’s our comprehensive breakdown of Koyfin’s key specifications and features:
| Specifications & Features | Details |
|---|---|
| Free Version | Available |
| Paid Version Cost | Plus: Starts at $49.00 (monthly plan); $39.00/month (annual plan) Premium: Starts at $110.00 (monthly plan); $79.00/month (annual plan) Advisor Core: Starts at $239.00 (monthly plan); $209.00/month (annual plan) Advisor Pro: Starts at $349.00 (monthly plan); $299.00/month (annual plan)*seasonal promotional discounts may apply |
| Markets Covered | Over 100,000 global equities, ETFs, and indices |
| Alerts and Automation | Plus: up to 50 alerts for price movements, technical signals, Valuation metrics, press releases, news, filings, and earnings transcripts Premium: everything on Plus and up to 500 alerts gives ability to monitor watchlists and portfolio positions Advisor Core: everything on Premium and the ff:Model Portfolio and Client Portfolio alerts, andadvisor workflow automation Advisor Pro: everything on Advisor Core and the ff:broader advisor automation.multiple custodian integrationsPMS integrationsPDF brokerage statement uploads and expanded reporting workflows. |
| Backtesting | Available for paid versions |
| Available Platforms | Web app, iOS app, and Android app |
| Real-Time Data Availability | Mix of live and 15-minute delayed on US and Canadian stocks, indices and ETFs; end-of-day data for other countries (regardless of the paid version) |
| Charting and Watchlists | Plus: Advanced charting, custom watchlists, reusable watchlist views, chart templates, mobile app access, and up to 8 custom dashboards Premium: Same as Plus, but with unlimited chart templates and unlimited custom dashboards Advisor Core: Premium charting and watchlist tools, plus model and client portfolios, client reports, and advisor-focused portfolio tracking Advisor Pro: Advisor Core charting and watchlist tools, plus expanded client reporting and deeper advisor workflow features |
| Customizable Dashboard | Yes; available on Plus, Premium, Advisor Core, and Advisor Pro |
| Our User Friendliness Rating | 4.3/5; modern and professional and great for advanced traders, but more data-heavy and not the most beginner-friendly for us |
4. Seeking Alpha
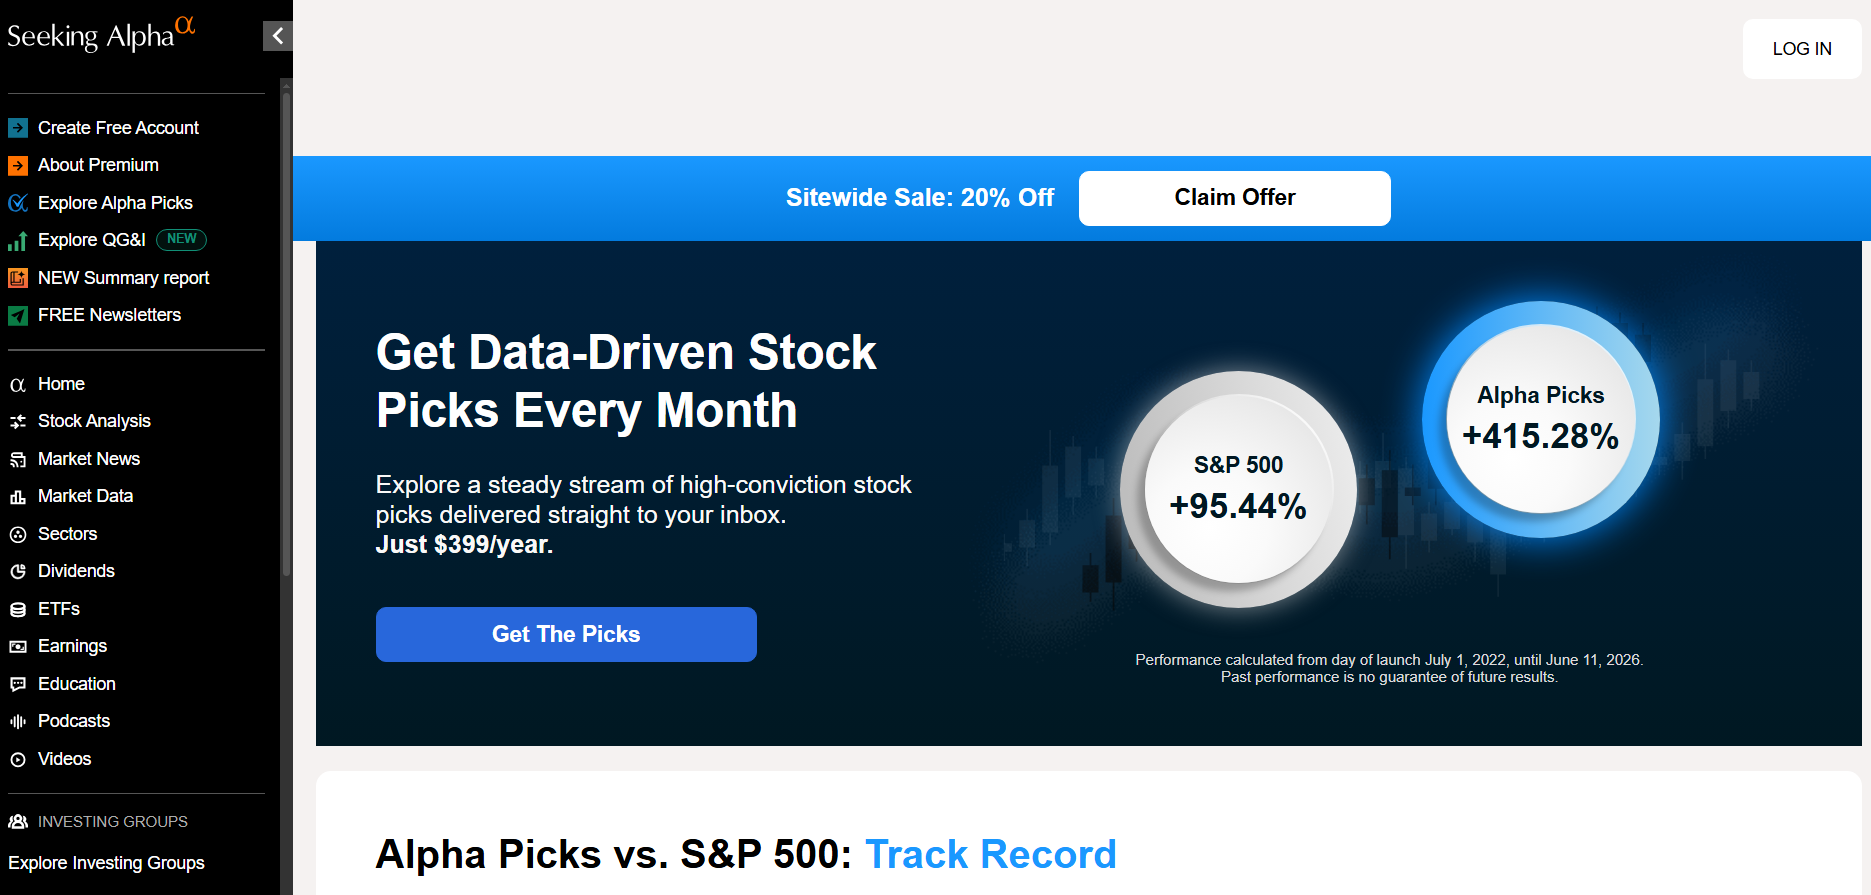
You may be wondering why we included Seeking Alpha (considering it’s more focused on investing than short-term trading, and that’s how it is mostly seen). The thing is, as experienced traders, we think it actually offers a very unique value proposition that not a lot of day traders realize.
Unlike other stock screeners, since it is a research-driven platform, you can better see the fundamentals behind the intraday moves. The tradeoff is that it is not a great pure speed or technical scanner, but it is very useful if you want your day trading watchlist to be supported by stronger research and market context. For example, in WR Trading, we find that it is amazing when you want to position during the pre-market based on fundamentals since it can hint potential catalysts when the market opens.
Key Pros:
- Best-in-class research-driven alerts
- Reliable and fast real-time US market data
- Available on web, iOS app, and Android app
Key Cons:
- Relatively much more expensive than other top stock screeners
- Research and fundamentals-driven (less technical analysis)
For Seeking Alpha, lean into its research capabilities. For day trading, utilize its US market data, ratings, analyst alerts, and portfolio warnings to build a watchlist of US stocks, indices, and ETFs before the trading session. But again, note that it’s better to use it more as a “research-backed scanner” before market opens rather than a pure execution scanner during trading hours.
Here’s our comprehensive breakdown of Seeking Alpha’s key specifications and features:
| Specifications & Features | Details |
|---|---|
| Free Version | Available |
| Paid Version Cost | Premium: $4.95 for the 1st month, then charges $299/yearPro: $99 for the 1st month, then charges $2,400/year*seasonal promotional discounts may apply |
| Markets Covered | US stocks, indices, and ETFs |
| Alerts and Automation | Premium:price alerts, rating alerts, content alerts, analyst alerts, portfolio digests, alerts, and warnings, automatic real-time alerts for linked holdings Pro: everything Premium, plusPro idea automation features such as real-time Upgrades and Downgrades access, Pro Quant Portfolio weekly trade alerts, Top Analyst and Short Ideas, Exclusive Coverage |
| Backtesting | Available for paid versions |
| Available Platforms | Web, iOS app, Android app |
| Real-Time Data Availability | Real-time data on US stocks, indices, and ETFs |
| Charting and Watchlists | Premium: Advanced charts, stock comparisons, portfolio tracking, custom portfolio views and ratings, holdings tracking, and downloadable portfolios Pro: same Premium charting and portfolio tools, plus Pro-exclusive idea lists, upgrades/downgrades, Short Ideas, and Pro Quant Portfolio |
| Customizable Dashboard | Yes; available on Premium and Pro |
| Our User Friendliness Rating | 4.1/5; easy to use for research-driven day traders, but the user interface is not the most intuitive for us |
5. Trade Ideas
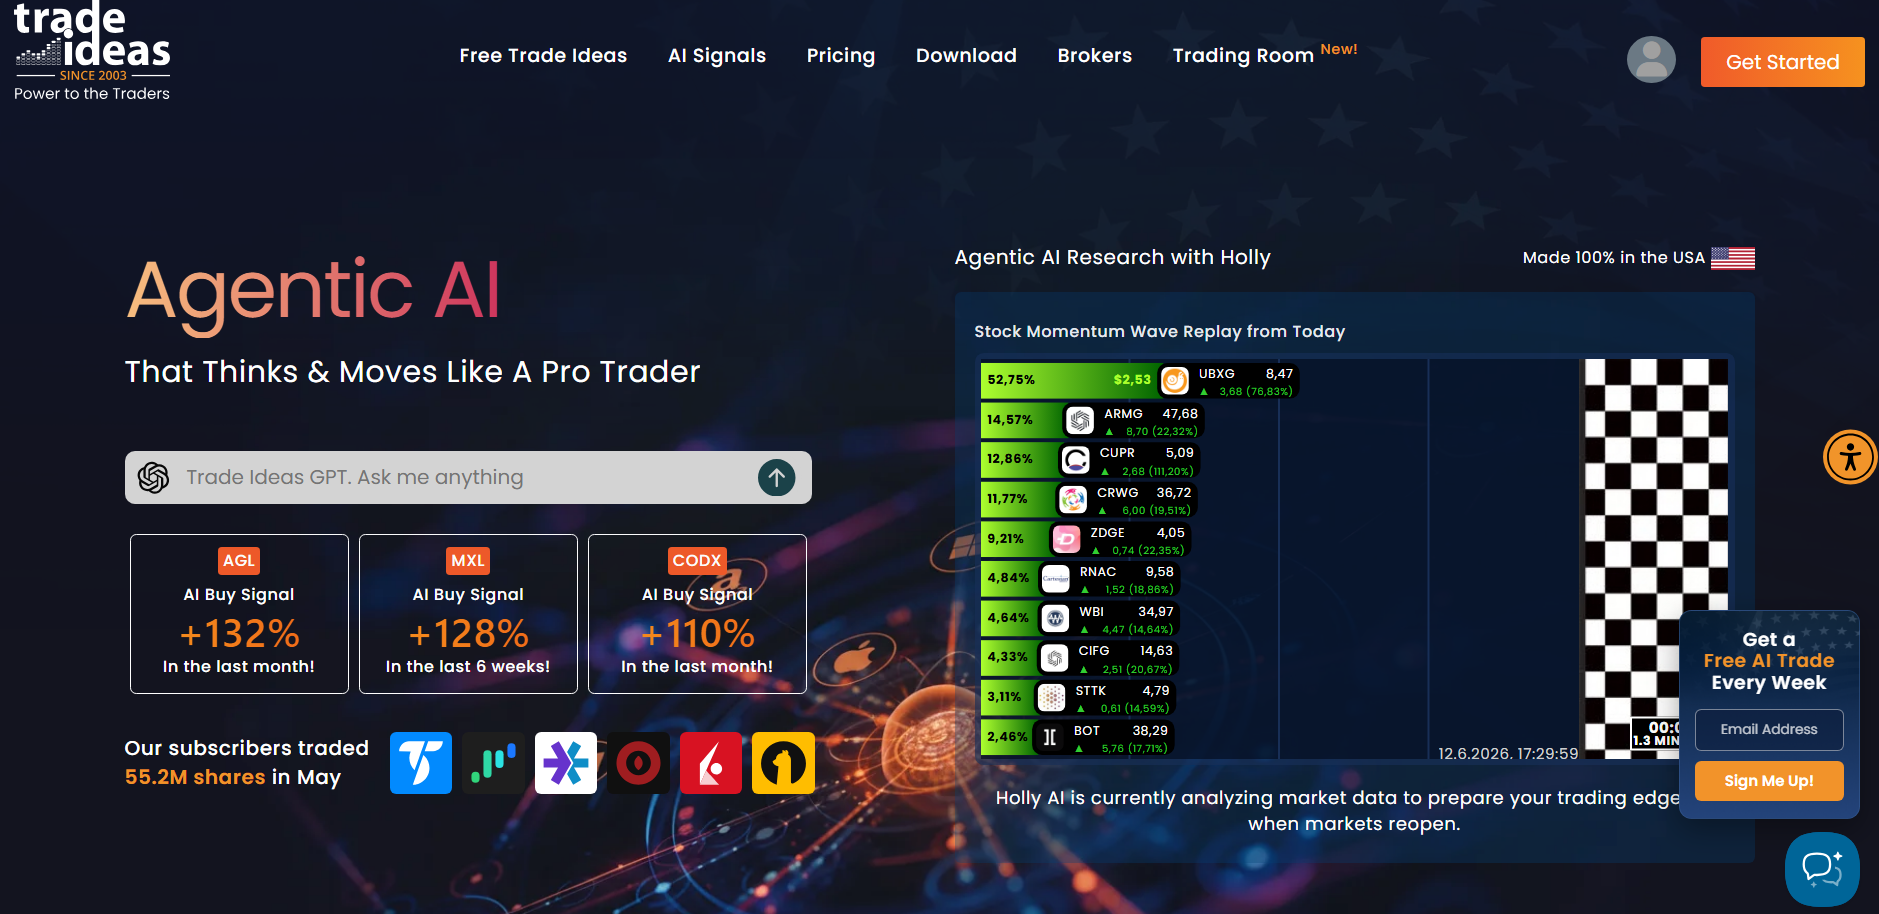
We like Trade Ideas as our fifth trading scanner because it is one of the most “serious” professional scanning tools in this list that we have used, especially for active traders focused on US and Canadian stocks, indices, and ETFs. While it is not cheap (and frankly, not that beginner-friendly), its real-time data, 500+ alerts and filters, AI signals, backtesting, and highly customizable layouts make it a legitimately powerful scanner for serious traders who already know what they are looking for.
Key Pros:
- One of our top choices for those looking to focus in US and/or Canadian instruments
- With a strong suite of 500+ alerts and filters
- With strong support for pre-market and after-hours data
Key Cons:
- Not very beginner friendly based on my testing and review
- No iOS or Android mobile app
At WR Trading, a great way we found to use Trade Ideas for day trading is to first build scanner windows around your preferred setups, then take advantage of its 500+ alerts and filters to track real-time movement in US and Canadian stocks, indices, and ETFs. For advanced traders, we think that TI Premium is where it becomes very valuable because its AI signals, backtested alert window strategies, system design tools, “Smart Risk Levels,” and auto trading features can legit turn it into a virtually complete professional scanning setup.
Here’s our comprehensive breakdown of Trade Ideas’s key specifications and features:
| Specifications & Features | Details |
|---|---|
| Free Version | Available |
| Paid Version Cost | TI Basic: Starts at $89 (monthly plan) or $1,068 (discounted annual plan) TI Premium: Starts at $178 (monthly plan) or $2,136 (discounted annual plan)*seasonal promotional discounts may apply |
| Markets Covered | US and Canadian stocks, indices and ETFs |
| Alerts and Automation | TI Basic: 500+ alerts and filters,price alerts, earnings and halt notifications on charts, pre-market and after-hours data,one-click trading and order management,auto-trading TI Premium: Everything in TI Basic, plus AI signals including entry and exit ideas, system design and backtesting, backtested alert-window strategies |
| Backtesting | Available for paid versions |
| Available Platforms | Web version and Windows desktop app |
| Real-Time Data Availability | TI Basic: Real-time data on US and Canadian stocks, indices and ETFs TI Premium: Same as TI Basic, plus AI-driven real-time signals |
| Charting and Watchlists | TI Basic: Up to 10 charts on screen, chart comparison and sharing, price alerts, customizable layouts, and unlimited personal watchlists TI Premium: same as TI Basic, plus up to 20 charts on screen, Channel Bar templates, Smart Risk Levels, RBI/GBI Window, and AI signals |
| Customizable Dashboard | Yes; available for both TI Basic and TI Premium |
| Our User Friendliness Rating | 4.0/5 Extremely capable and built for serious day traders, but not very beginner-friendly in our testing |
6. TrendSpider
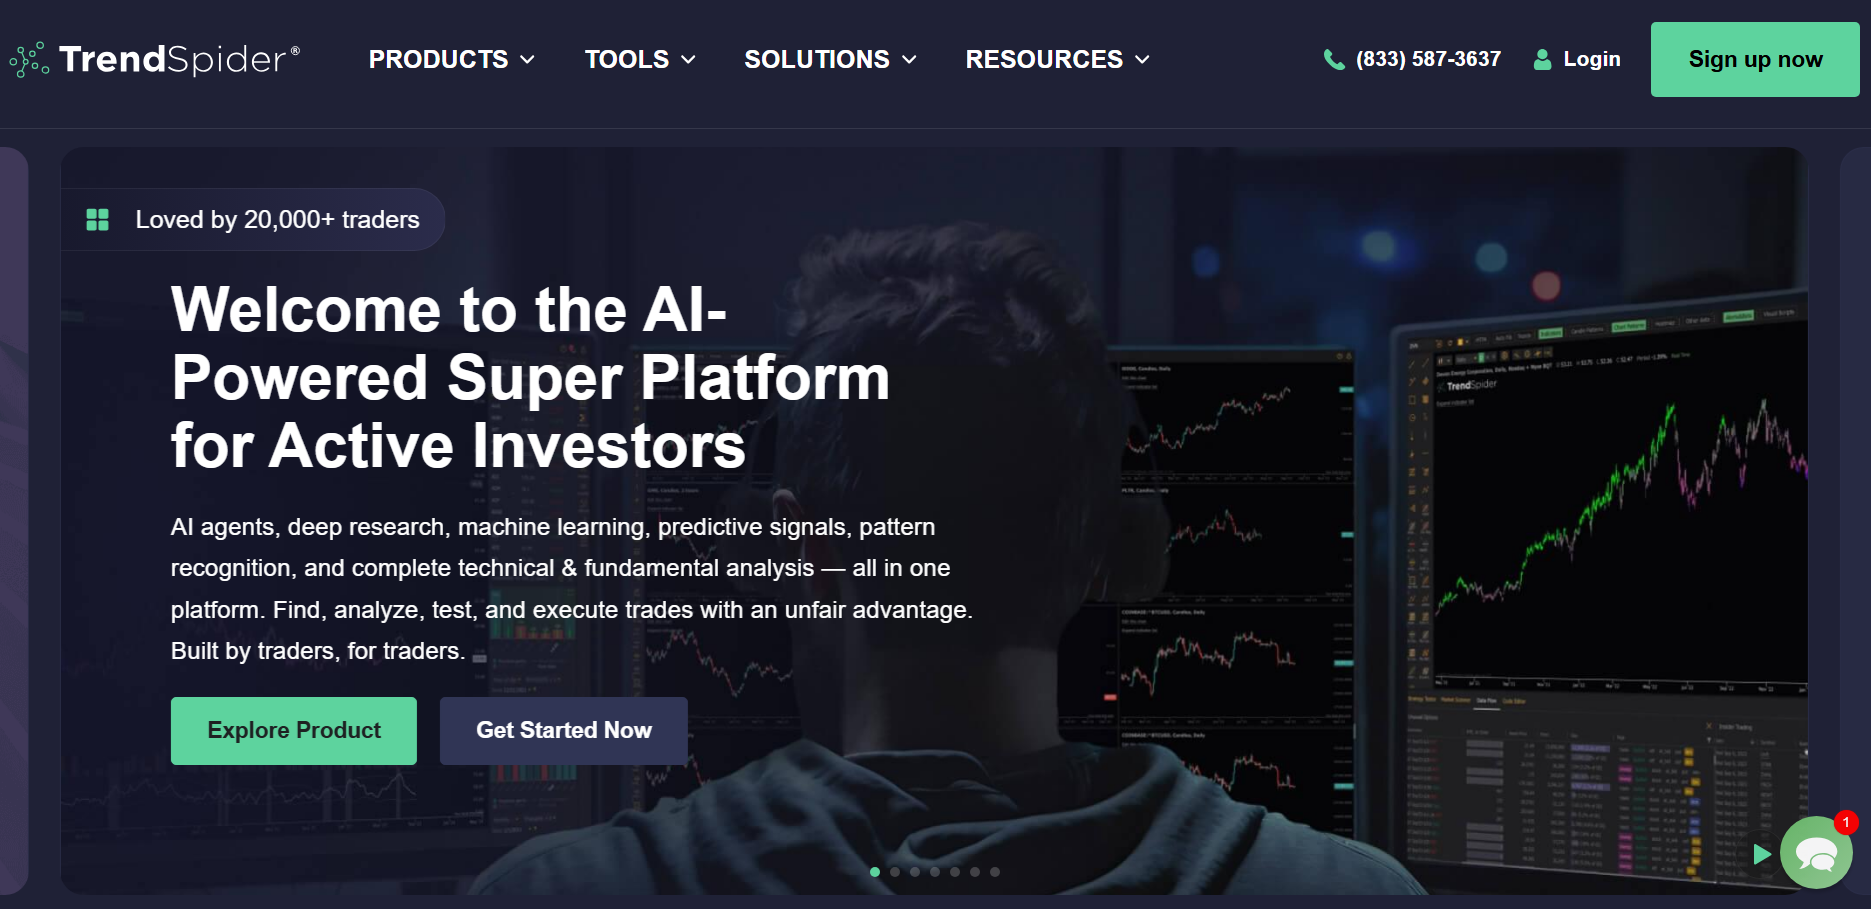
Next on our list is TrendSpider, which we consider to be one of the strongest scanners for traders who want advanced automation. Having technical alerts, bots, scheduled scanners, and pattern recognition in one scanner is a valuable proposition for those traders who want high-level automation. That said, based on our experience, it is not the simplest scanner to use (especially if you’re a beginner). But for experienced traders who have an automation-heavy workflow, TrendSpider clearly stands out from its competition.
Key Pros:
- Strong automation offerings, including dynamic alerts, multi-factor alerts, cloud alerts, webhook alerts, and scheduled scanners.
- Supports trading bots, Strategy Bots, AI alert/scanner creation, and SignalStack-based order automation
- Available on web browser, iOS, Android, and Chrome extension
Key Cons:
- Relatively expensive compared to other top scanners
- With steeper learning curve for beginners versus other top scanners
For day trading, we advise using TrendSpider to build smart watchlists and scheduled scanners around your preferred technical setups, then use its dynamic/multi-factor alerts, bots, and automated trendlines to monitor those setups as price action develops. For serious intraday use, we really recommend looking more closely at Premium or Enhanced plans because the lower scanner timeframes, deeper backtesting, higher alert limits, and bigger bot capacity make the platform far more useful for automation-heavy day trading routine.
Here’s our comprehensive breakdown of TrendSpider’s key specifications and features:
| Specifications & Features | Details |
|---|---|
| Free Version | Available |
| Paid Version Cost | Standard: Starts at $82 (monthly plan); $225 (quarterly plan); $648 (annual plan) Premium: Starts at $137 (monthly plan); $378 (quarterly plan); $1,092 (annual plan) Enhanced: Starts at $183 (monthly plan); $501 (quarterly plan); $1,464 (annual plan)*ongoing promotion of $7 to try any plan for 14 days; additional seasonal promotions may apply afterward |
| Markets Covered | US stocks, indices and ETFs (8,000 real-time stocks and 3,300 real-time ETFs) |
| Backtesting | Available for paid versions |
| Available Platforms | Web browser, iOS app, Android app, and Chrome extension |
| Real-Time Data Availability | Real-time data on US stocks, indices and ETFs (regardless of the paid plan) |
| Charting and Watchlists | *All paid plans include Full TrendSpider charting and watchlist tools Including 5 open workspaces, custom and smart watchlists, multi-timeframe analysis, automated trendlines, and pattern recognition |
| Customizable Dashboard | Yes; available on Standard, Premium, and Enhanced |
| Our User Friendliness Rating | 4.1/5; very capable, modern, and highly automated, but not the simplest to use in our testing and has a relatively steep learning curve |
For Alerts and Automation you can use following Features:
- Standard:10 alerts for 30 days, 5 trading bots, dynamic and multi-factor alerts, cloud and webhook alerts, scheduled scanners, smart watchlists, AI alert/scanner creation, Strategy Bots, SignalStack-based order automation, lowest scanner timeframe is 2 hours, and backtesting supports 2-hour backtests with 2K depth
- Premium: everything on Standard plus:50 alerts for 90 days, 10 trading botslowest scanner timeframe becomes 5 minutes and backtesting supports 5-minute backtests with 10K depth
- Enhanced:Everything on Premium plus:100 alerts for 180 days, 50 trading bots, lowest scanner timeframe becomes 1 minute and backtesting supports 1-minute backtests with 20K depth
7. TC2000
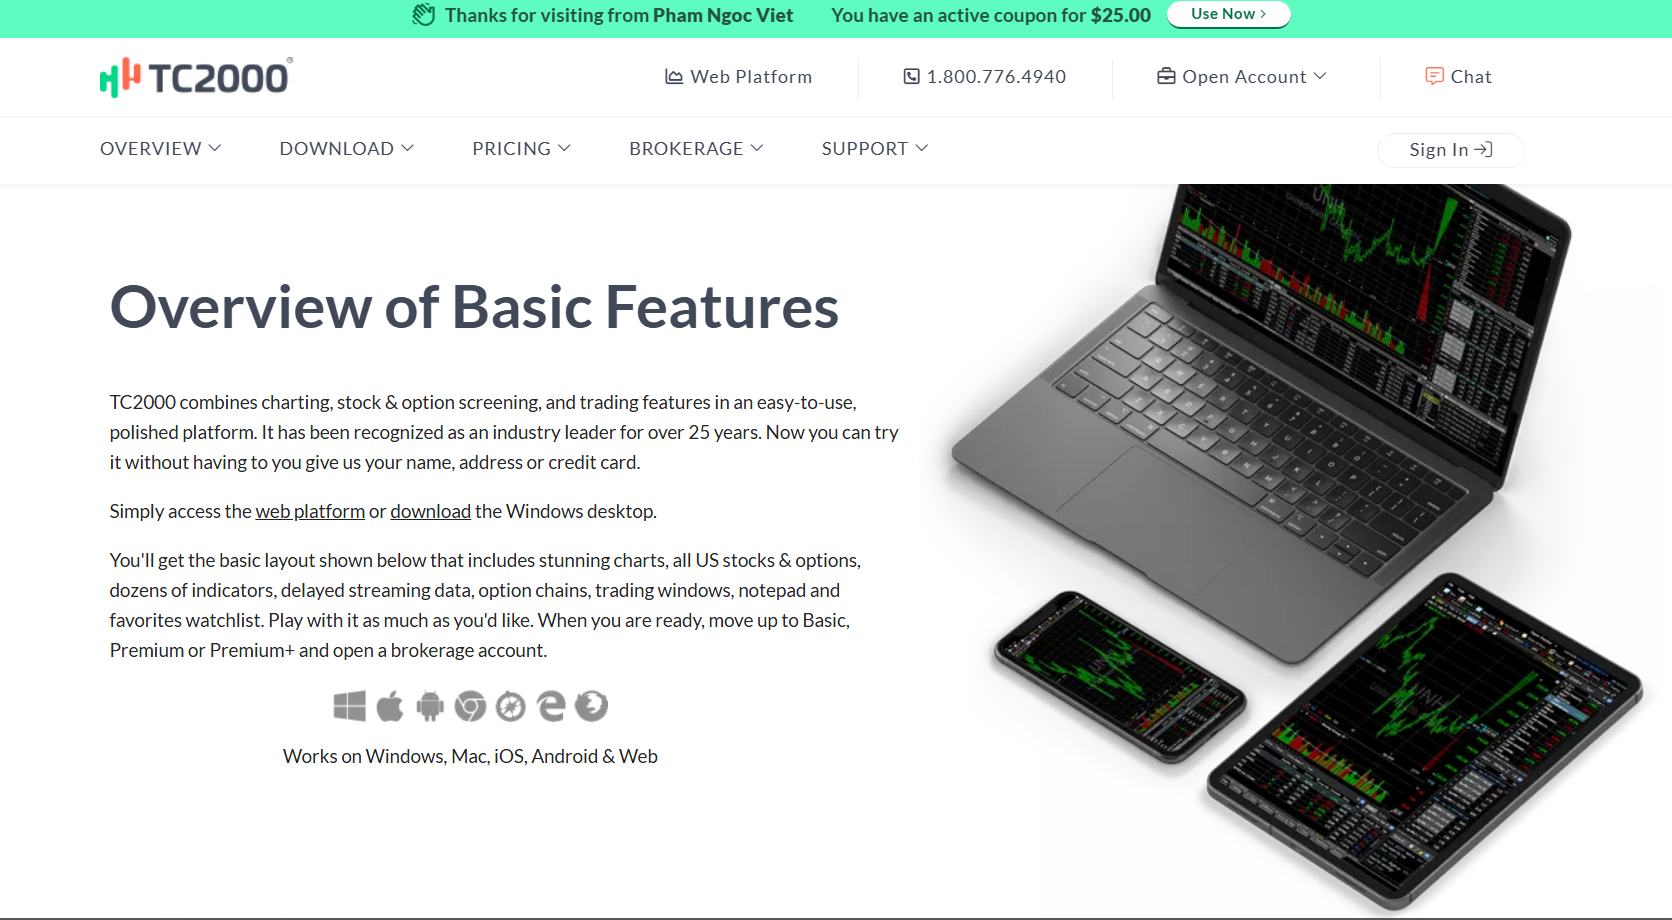
TC2000 is genuinely one of the strongest classic scanners for experienced day traders who want real-time scanning, sorting, alerts, live streaming watchlists, and chart-based workflows. When we used it, one of the first thoughts we had was “this is more technical and old school than some newer scanners.” That said, for active traders who want control, customization, and speed across US and Canadian stocks, indices, and ETFs, it actually still holds up very well based on our testing.
Key Pros:
- Strong charting and watchlist tools, including customizable layouts, personal watchlists, history columns, and multi monitor support.
- Premium+ supports a staggering 1,000 real-time customizable alerts, Market Pulse gauges, and live auto refreshing filters and sorts.
- Available across many platforms, including Windows desktop, web, Mac, iPhone, iPad, Android, Chromebook, and Kindle Fire.
Key Cons:
- More technical and old school in feel based on my testing and review
- Its real-time scanning and sorting only starts on the Premium plan
For day trading, we recommend using “EasyScan” around your preferred price and/or indicator, then use real-time scanning and sorting to monitor the strongest US or Canadian stocks, indices, and ETFs. Note that from our experience, Premium or Premium+ is where TC2000 becomes far more useful because the real-time customizable alerts, pre and post market scan modes, live auto refreshing filters, intraday performance columns, and watchlist tools can create a very efficient day trading workflow, something we think can give a real edge for those who can take advantage of these.
Here’s our comprehensive breakdown of TC2000’s key specifications and features:
| Specifications & Features | Details |
|---|---|
| Free Version | Available |
| Paid Version Cost | Basic: Starts at $24.99 (monthly plan); $249.90 (annual plan) Premium: Starts at $49.99 (monthly plan); $499.90 (annual plan) Premium+: Starts at $99.99 (monthly plan); $999.90 (annual plan)*seasonal promotional discounts may apply |
| Markets Covered | US and Canadian stocks, indices and ETFs |
| Backtesting | Available for paid versions |
| Available Platforms | Windows desktop app, web platform, Mac, iPhone, iPad access, Android phone and tablet, Chromebook, and Kindle Fire |
| Real-Time Data Availability | Basic: Real-time data on US and Canadian stocks, indices and ETFs Premium: same as Basic, plus real-time scanning and sorting (using indicators, charting data, and formulas) Premium+: same as Premium, plus real-time Market-Pulse gauges and indicators, and live auto-refreshing filters and sorts |
| Charting and Watchlists | Basic: Stock, Indices and ETFs charting, live streaming watchlists, customizable layouts, and personal watchlists Premium: Basic charting/watchlists, plus chart drawing tools, real-time scanning and sorting, stack/group/hide watchlist columns, history columns, and multi-monitor support Premium+: Premium charting/watchlists, plus intraday performance columns, and WatchList Price Index |
| Customizable Dashboard | Yes; available on Basic, Premium, and Premium+ |
| Our User Friendliness Rating | 4.1/5; very efficient for experienced active traders, but more technical and old-school in feel |
For Alerts and Automation you can use following Features:
- Basic: Includes live streaming watchlistsreal-time financial news, and real-time paper trading with limit orders from chart trendlines and order tickets
- Premium: everything on Basic, plus100 real-time customizable alertsalerts can be set on price points, trendlines, EasyScans, indicator conditions, and reminders, Real-time scanning and sorting, EasyScan Wizard, Personal Criteria Formulas, Morning Pre-Buzz, most-watched/trending stocks, history columns, and pre/post-market scan/watchlist mode
- Premium+: Everything on Premium, plus1,000 real-time customizable alerts, real-time Market-Pulse Gauges, real-time Market-Pulse Indicators, live auto-refreshing filters and sorts, intraday performance columns
8. TradingView
Finally, we included TradingView because we really observed that it has the best free version in this list, while still giving traders access to global stocks, indices, and ETFs across 150+ exchanges from 50+ countries, which is very impressive. But what really makes TradingView stand out is its charting, which is so good that many traders use it as their default charting tool even if they use another scanner for trade ideas. In fact, most of us at WR Trading use TradingView as our preferred and default charting tool.
Key Pros:
- In our opinion, it has best free version among all the scanners in this list
- A wide coverage of global stocks, indices, and ETFs across 150+ exchanges from 50+ countries
- Very user-friendly based on our testing and review, with the highest rating in this list at 4.9/5 stars
- Excellent charting tools, which many traders already use as their default charting platform
Key Cons:
- While it has the best free version, its paid versions are nothing special compared to others in this list
- Watchlist alerts are very limited, with no watchlist alerts on Essential and only higher limits on Premium and Ultimate
One of the best ways to use TradingView specifically for day trading is to start with its stock screener to filter global stocks, indices, and ETFs, then move the strongest stocks you find directly into its charts for a deeper price action review and analysis. From there, we recommend using its real-time data support, technical and price alerts, multiple watchlists, and of course its excellent charting tools to build a clean trading setup (where you really won’t be needing to jump between platforms).
Here’s our comprehensive breakdown of TradingView’s key specifications and features:
| Specifications & Features | Details |
|---|---|
| Free Version | Available |
| Paid Version Cost | Essential: Starts at $14.95 (monthly plan); $12.95/month (annual plan) Plus: Starts at $34.95 (monthly plan); $29.95/month (annual plan) Premium: Starts at $69.95 (monthly plan); $59.95/month (annual plan) Ultimate: Starts at $239.95 (monthly plan); $199.95/month (annual plan)*seasonal promotional discounts may apply |
| Markets Covered | Global stocks, indices, and ETFs across 150+ exchanges from 50+ countries |
| Backtesting | Available for paid versions |
| Available Platforms | Web browser, Windows desktop app, macOS desktop app, Linux desktop app, iOS app, and Android app |
| Real-Time Data Availability | Supports real-time data (regardless of the paid plan) Note: some local exchange requires separate paid market-data subscriptions |
| Customizable Dashboard | Yes; available on Essential, Plus, Premium, Ultimate |
| Our User Friendliness Rating | 4.9/5; The most user-friendly and beginner-friendly overall based on our own testing |
For Alerts and Automation you can use following Features:
- Essential:20 price alerts,20 technical alerts, 0 watchlist alerts, screener auto-refresh at 10 sec / 1 min, multi-condition alerts, webhook notifications, Pine Screener, News Flow alerts for up to 10 saved news flows, data series, indicators, strategies,and chart patterns/drawings alerts.
- Plus: everything on Essential, plusup to 100 price alerts, and up to 100 technical alerts
- Premium: everything on Plus, with400 price alerts, 400 technical alerts,and 2 watchlist alerts
- Ultimate: Everything on Premium, plus1,000 price alerts, 1,000 technical alerts, and 15 watchlist alerts
For Charting and Watchlists you can use:
- Essential: 2 charts/tab, 5 indicators/chart, 10K historical bars, 10 parallel chart connections, multiple watchlists, Bar Replay, chart data export, custom timeframes, custom Range Bars, Volume Profile, no watchlist alerts
- Plus: Same as Essential, but with 4 charts/tab, 10 indicators/chart, 10K historical bars, 20 parallel chart connections
- Premium: Same as Plus, but with 8 charts/tab, 25 indicators/chart, 20K historical bars, 50 parallel chart connections, and 2 watchlist alerts
- Ultimate: Same as Premium, but with 16 charts/tab, 50 indicators/chart, 40K historical bars, 200 parallel chart connections and 15 watchlist alerts
How To Choose The Best Day Trading Scanner
In order to find the best screener for day traders with a solid real-time scanner, we highly recommend considering six factors (which we also used to pinpoint the 8 scanners in the list), namely:
- the reliability of its real-time data when using the live stock screener,
- the scanning speed,
- the quality and depth of screening filters when using the stock screener to filter different instruments/stocks,
- how its alerts and automation work and its settings and setup process,
- the ease of use and user interface of its web, mobile, and software versions (whichever is available), and
- its pricing and value for money proposition.
By considering all these factors, we are confident you will find the best day trading scanner specifically for you.
What Are The Costs Of Market Scanners For Day Traders?
The different costs heavily depend on the specific stock scanner’s paid plans, but high-quality and solid real-time scanners generally range from $15/month to as high as $350/month (before any discount). Note that you don’t have to pay upfront, as these top scanners usually offer free versions and/or free trials for their paid plans for you to be able to test and evaluate the key factors we highlighted.
On average, market scanners specifically for day traders (especially automated and professional scanning tools) are pricier versus less competitive (and less known) stock scanners. That said, there are still top scanners such as InvestingPro and TradingView offering affordable yet very capable paid plans starting at only $14.99 and $14.95 (before any discount), respectively.
Here’s a comprehensive cost breakdown of our top 8 market scanners for day traders:
| Scanner | Cost Details |
|---|---|
| InvestingPro | Investing Pro: starts at $14.99/month or $179.99/year Investing Pro+: starts at $37.49/month or $449.99/year *prices vary depending on your country/region and seasonal promotional discounts may apply |
| Finviz | Finviz Elite: Starts at $39.50 (monthly plan); $24.96/month (annual plan)*seasonal promotional discounts may apply |
| Koyfin | Plus: Starts at $49.00 (monthly plan); $39.00/month (annual plan) Premium: Starts at $110.00 (monthly plan); $79.00/month (annual plan) Advisor Core: Starts at $239.00 (monthly plan); $209.00/month (annual plan) Advisor Pro: Starts at $349.00 (monthly plan); $299.00/month (annual plan)*seasonal promotional discounts may apply |
| Seeking Alpha | Premium: $4.95 for the 1st month, then charges $299/year Pro: $99 for the 1st month, then charges $2,400/year*seasonal promotional discounts may apply |
| Trade Ideas | TI Basic: Starts at $89 (monthly plan) or $1,068 (discounted annual plan) TI Premium: Starts at $178 (monthly plan) or $2,136 (discounted annual plan)*seasonal promotional discounts may apply |
| TrendSpider | Standard: Starts at $82 (monthly plan); $225 (quarterly plan); $648 (annual plan) Premium: Starts at $137 (monthly plan); $378 (quarterly plan); $1,092 (annual plan) Enhanced: Starts at $183 (monthly plan); $501 (quarterly plan); $1,464 (annual plan)*ongoing promotion of $7 to try any plan for 14 days; additional seasonal promotions may apply afterward |
| TC2000 | Basic: Starts at $24.99 (monthly plan); $249.90 (annual plan) Premium: Starts at $49.99 (monthly plan); $499.90 (annual plan) Premium+: Starts at $99.99 (monthly plan); $999.90 (annual plan)*seasonal promotional discounts may apply |
| TradingView | Essential: Starts at $14.95 (monthly plan); $12.95/month (annual plan) Plus: Starts at $34.95 (monthly plan); $29.95/month (annual plan) Premium: Starts at $69.95 (monthly plan); $59.95/month (annual plan) Ultimate: Starts at $239.95 (monthly plan); $199.95/month (annual plan)*seasonal promotional discounts may apply |
How Can A Day Trading Scanner Help While Trading?
First, for beginner day traders, a live stock screener can help spot active stocks without manually checking hundreds of charts at a time. In addition, it can also help with your trade setup by narrowing the market based on basic filters such as price movements, volume, volatility, and top movers.
Second, for intermediate-level traders, a solid real-time scanner can help monitor stronger intraday opportunities closely as price action develops. More importantly, you can use the stock screener and filter instruments based on momentum, technical indicators, sector activity, and other conditions that match your trading strategy.
Finally, for professional traders, professional scanning tools really help advanced traders build a faster, more systematic workflow using alerts, saved scans, and automated setups. Many top platforms also let you create your own stock screener, which is very useful for traders who want custom filters built around their exact trading rules and system.
Pros and Cons Of Stock Market Scanners For Day Traders
Stock market scanners, regardless of how “good” they are, are still not perfect trading tools. Hence, it’s incredibly important to weigh the key pros and cons to find out if they are something you should invest in or not. To help with this decision, here is our honest quick rundown of the most important pros and cons you need to consider:
Pros of using stock market scanners:
- Can reveal potential trades that you may otherwise miss by just doing manual chart checking
- A solid real-time scanner can help identify fast-moving stocks before they become obvious
- Useful for building repeatable trading routines (with specific entry conditions)
- Can help day traders react faster to specific setups (breakouts, reversals, and volume spike)
- Helps you backtest and refine your day trading strategy
- Can help you immensely in your workflow and reduce your screen time
- Help traders stay objective by using defined criteria (instead of relying on emotion or chasing popular stocks)
- Can improve preparation before the market opens by identifying stocks already showing heavy activity in pre-market trading
Cons of using stock market scanners:
- The costs of professional scanning tools can be very expensive
- Poor scanner setup and settings can create noisy results (beginners often struggle with this)
- Even the best stock scanners can produce false signals
- Scanners can encourage overtrading as it shows many “potential” trade candidates
- Scanners can create false confidence that all results are automatically “good” trades to take
Conclusion: A Great Stock Scanner Can Give You a Real Edge
To conclude, solid stock market scanners can be a worthwhile investment if you can utilize them in a way that will give you a real edge. These 8 stock market scanners are among the most valuable scanning tools out there, and they stand out in different ways. That said, based on our extensive testing and analysis, InvestingPro is our overall top pick as the best scanner specifically for day trading.
InvestingPro’s reliability, speed, quality and depth of its scanning filters, alerts and automation (including AI integration and professional-grade tools), and a user-friendly interface, while still being one of the cheapest options, create a value proposition that is very hard to beat. It checks all of the factors we considered and is something we genuinely highly recommend for those looking for an affordable yet highly capable stock screener. That said, we know it can still be a challenge to take all of this info in. So, if you want to learn how expert traders utilize InvestingPro or other top screeners in this list and get access to our proven and tested trading strategies we developed and pioneered at WR Trading over the years, you can apply to our exclusive one-on-one mentorship at https://wrtrading.com.
FAQs: Most Asked Questions on Stock Market Scanners
What is the risk of relying on stock market scanners?
The biggest risk of relying on scanners is overtrading. Scanners can and will produce constant alerts, which may push you to enter trades without enough confirmation simply because you’re afraid that you might miss a trade opportunity.
How do I reduce false trading alerts from stock scanners?
We recommend using stricter filters that complement your trading strategy. This can include minimum volume, specific price range, spread, and catalyst requirements. Also, if you have more than 1 trading strategy, we recommend setting a different set of filters tailored to each strategy.
Should beginners use advanced stock scanners?
We do not recommend beginners to use (and pay) advanced and professional scanning tools. This is because it can make trading overly complex (can cause information overload). When you are a beginner, most likely, you have not dialed in your risk management. We recommend using a simple (and free) scanner at first and focus on improving your risk management.
Should I use multiple scanners at the same time?
While it sounds like using multiple scanners can be some sort of “cheat code” to trading success, based on our experience, it mostly creates distraction and too much (sometimes, even conflicting) data. Hence, we recommend choosing and sticking with one scanner at a time.
Is it better to scan the entire stock market or focus on a specific sector?
In our experience, it’s better to focus on a specific sector or industry (or type of stock) rather than scanning the entire stock market when day trading. This is because scanning the entire stock market can return too many potential trade candidates that it will be time-consuming to confirm each of them.

