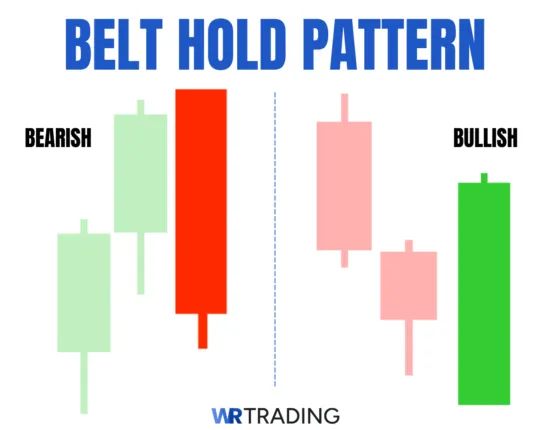
The Belt Hold candlestick pattern is a simple yet meaningful price formation that consists of a single large candlestick that opens with a gap and moves strongly in the opposite direction. It can appear in both bullish and bearish markets and signals a potential reversal, typically forming at the end of a strong trend.
The bullish version appears at the end of a downtrend, while the bearish version appears at the top of an uptrend.
This pattern is significant because it reflects a sudden shift in sentiment and often catches the market off guard — making it a useful entry signal for reversal traders looking to get positioned early. It’s a pattern that shows a candlestick opening at one extreme of its trading range and closing near the opposite extreme, with little to no shadow on the opening side.
To trade the Belt Hold Candlestick Pattern, first confirm that it forms after a clear trend — a bearish Belt Hold at the top of an uptrend or a bullish Belt Hold at the bottom of a downtrend. Enter a trade in the direction of the reversal when the next candle breaks above (for bullish) or below (for bearish) the Belt Hold’s range.
You’ll place a stop-loss just beyond the pattern’s extreme, and set a target based on the nearest support/resistance level or a favorable risk-reward ratio (e.g. 2:1). For added confirmation, you can use volume or momentum indicators like RSI or MACD. The pattern stands out as a significant indicator of potential trend reversal and, being characterized by a single candlestick, this pattern can be either bullish or bearish, depending on its formation within the prevailing trend.
In this article, we delve deep into the Belt Hold Candlestick Pattern, exploring its definition, formation, psychological underpinnings, identification methods, trading strategies, success rates, and more. Drawing from our experience and extensive research, we provide practical insights and examples to help you effectively incorporate this pattern into your trading toolkit.
(Learn To Trade And Read Candlestick Patterns Like A Pro)
What is a Bullish Belt Hold?
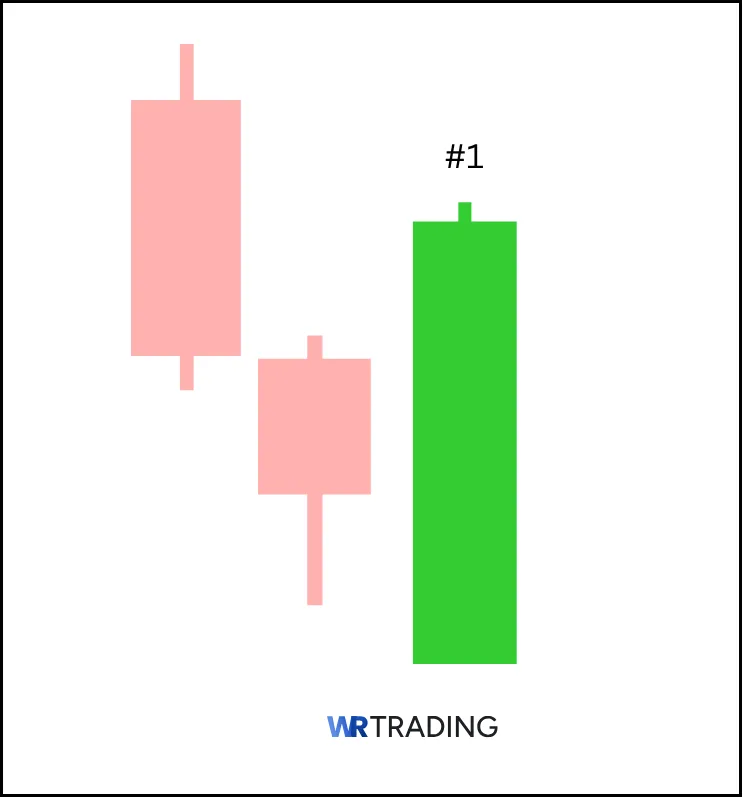
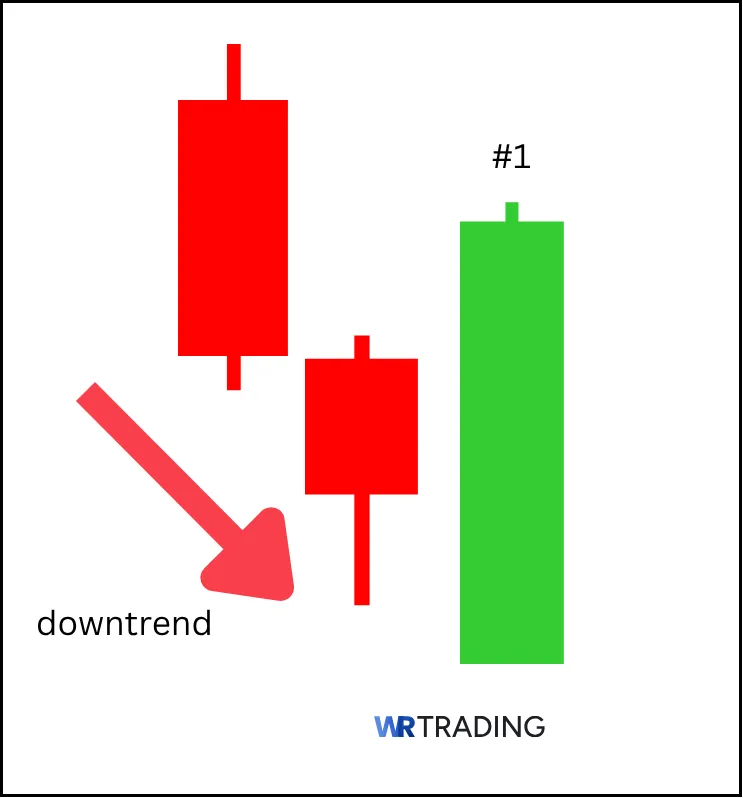
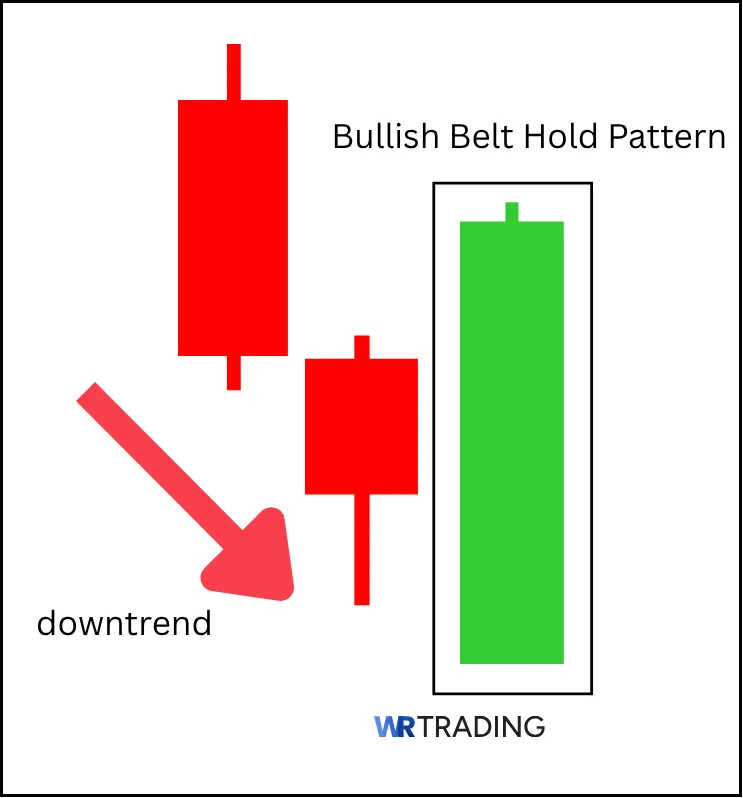
A Bullish Belt Hold is a single-candle bullish reversal pattern that typically appears during a downtrend, signaling a potential shift in market sentiment from bearish to bullish. This pattern is characterized by a long bullish candlestick that opens at its low and closes near its high, with little to no lower shadow.
The absence of a lower shadow indicates that buyers dominated the session from the outset, pushing prices higher without significant opposition from sellers. The Bullish Belt Hold pattern is formed when the market opens at a new low, but strong buying pressure drives the price upward throughout the session, resulting in a long green candlestick.
This formation suggests that the downtrend may be losing momentum, and a reversal to an uptrend could be imminent.
Key Facts of The Bullish Belt Hold Candlestick Pattern:
- Type of Pattern: Bullish reversal
- Construction characteristics: Single long bullish candlestick with no lower shadow and a small upper shadow.
- Trend prior to pattern: Downtrend
- Trade forecast: Potential reversal to an uptrend.
- Interpretation: Indicates strong buying pressure and a possible shift in market sentiment.
- Stop-loss placement: Below the low of the Bullish Belt Hold candlestick.
- Opposite pattern: Bearish Belt Hold
- Success rate: Approximately 71% in bullish reversals.
What is a Bearish Belt Hold?
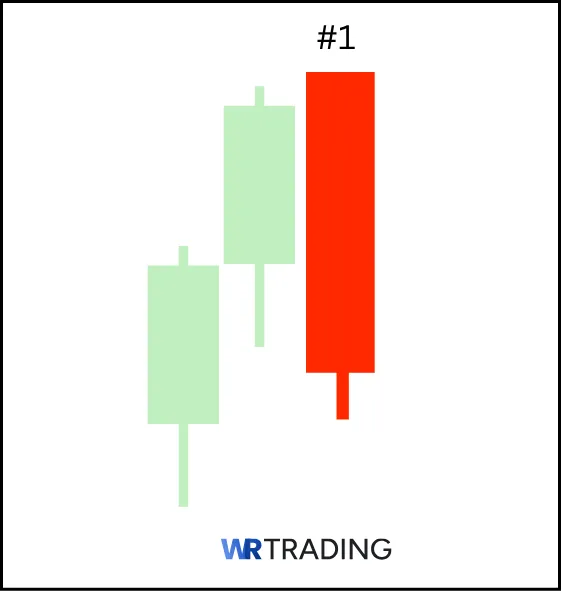
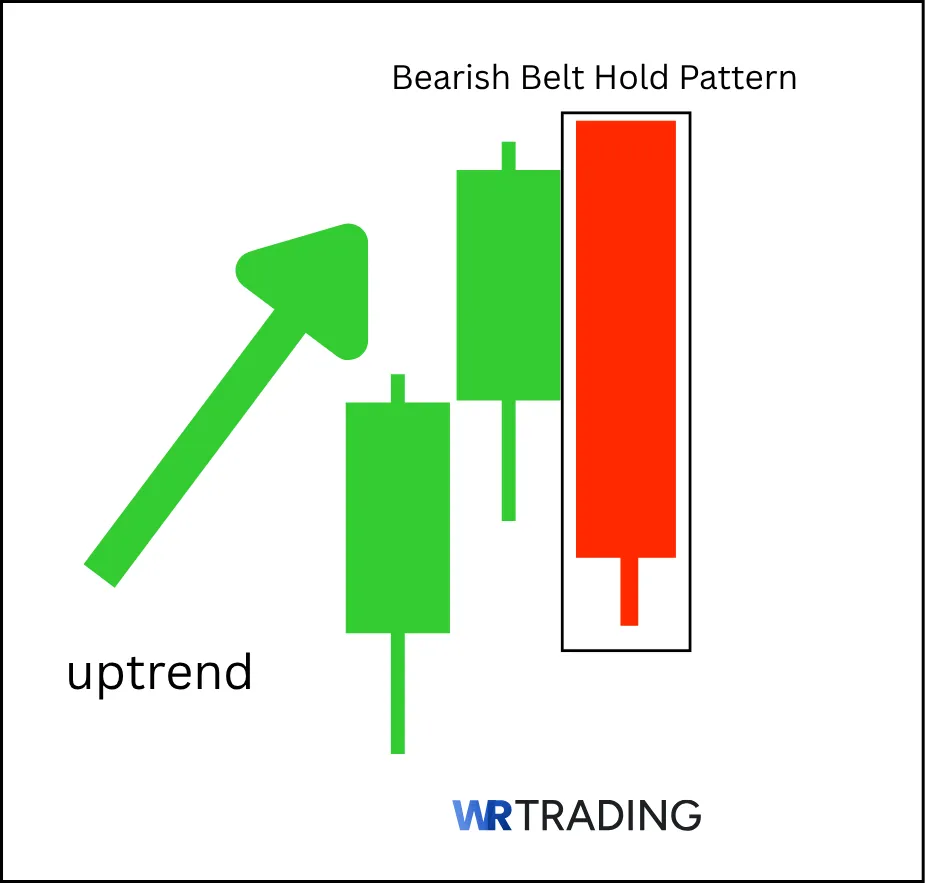
Conversely, a Bearish Belt Hold is a single-candle bearish reversal pattern that typically emerges during an uptrend, indicating a potential shift in market sentiment from bullish to bearish. This pattern features a long bearish candlestick that opens at its high and closes near its low, with little to no upper shadow.
The lack of an upper shadow signifies that sellers controlled the session, driving prices down without significant resistance from buyers. The Bearish Belt Hold pattern is formed when the market opens at a new high, but selling pressure dominates the session, pushing the price downward and resulting in a long red candlestick.
This formation suggests that the uptrend may be weakening, and a reversal to a downtrend could be forthcoming.
Key Facts of The Bearish Belt Hold Candlestick Pattern:
- Type of Pattern: Bearish reversal
- Construction characteristics: Single long bearish candlestick with no upper shadow and a small lower shadow.
- Trend prior to pattern: Uptrend
- Trade forecast: Potential reversal to a downtrend.
- Interpretation: Indicates strong selling pressure and a potential move in the market’s sentiment.
- Stop-loss placement: Above the high of the Bearish Belt Hold candlestick.
- Opposite pattern: Bullish Belt Hold
- Success rate: Approximately 68% in bearish reversals.
(Learn To Trade And Read Candlestick Patterns Like A Pro)
How is the Belt Hold Pattern Formed?
The Belt Hold pattern is formed during a prevailing trend—either a downtrend for the bullish variant or an uptrend for the bearish variant. It consists of a single candlestick that opens at one extreme of its trading range and closes near the opposite extreme, with little to no shadow on the opening side.
The Bullish Belt Hold formation occurs in a downtrend, and the candlestick opens at the session’s low and closes near the high, forming a long green body with no lower shadow.
On the other hand, a Bearish Belt Hold formation occurs in an uptrend., where the candlestick opens at the session’s high and closes near the low, forming a long red body with no upper shadow. This suggests that sellers have dominated the session, driving prices downward from the outset.
What does the Belt Hold Candlestick Pattern Indicate?
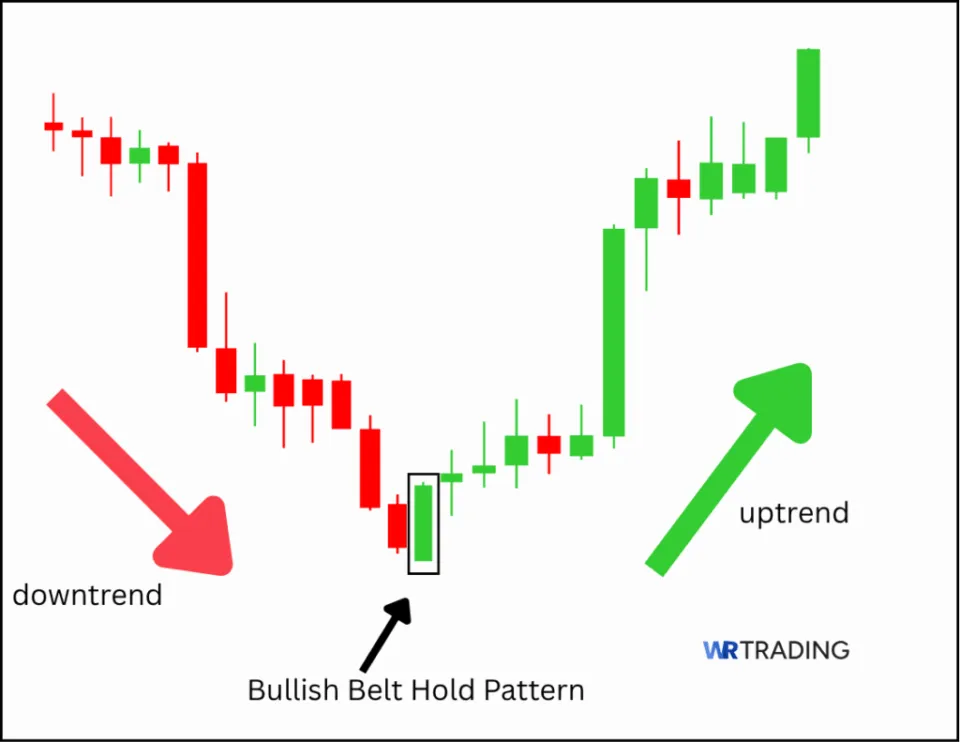
The Belt Hold candlestick pattern serves as an indicator of a potential reversal in the prevailing market trend, reflecting a significant shift in market psychology. In a downtrend, the appearance of a Bullish Belt Hold suggests that buyers are gaining strength, overpowering sellers, and potentially initiating a reversal to an uptrend.
This pattern indicates a change in sentiment from bearish to bullish, whereas in an uptrend, the emergence of a Bearish Belt Hold implies that sellers are taking control, overpowering buyers, and possibly triggering a reversal to a downtrend.
In both cases, the lack of shadows and the dominant body size indicate conviction from the reversing side. It’s a strong single-candle message that the previous trend may be over. This latter pattern reflects a shift in sentiment from bullish to bearish.
The Belt Hold pattern reflects a sharp and decisive reversal in sentiment. It’s made up of a single long candlestick with little to no shadow on one side, showing that the market opened with a gap and then moved strongly in one direction all session.
The Belt Hold pattern, therefore, signifies a decisive move by market participants, indicating a potential change in the direction of the price movement. The formation of the Belt Hold pattern signifies a strong shift in market sentiment, often indicating a potential reversal in the prevailing trend.
Where does the Name of the Belt Hold Candlestick Pattern come from?
The term “Belt Hold” in candlestick charting is derived from the Japanese word “Yorikiri,” a sumo wrestling technique where a wrestler grabs their opponent’s belt and forces them out of the ring. This analogy reflects the pattern’s representation of a strong, decisive move in the market, where one side gains control and pushes the price in their favor.
In the context of the Bullish Belt Hold, the pattern symbolizes buyers taking control from the opening bell, driving prices higher and potentially reversing a downtrend. Conversely, the Bearish Belt Hold represents sellers dominating the session, pushing prices lower and possibly reversing an uptrend.
(Learn To Trade And Read Candlestick Patterns Like A Pro)
What is an Example of the Belt Hold Pattern?
Let’s use the GBP/USD forex pair for both versions:
Bullish Example (end of a downtrend):
- Candle opens at 1.2080 (gapping below previous close).
- Closes at 1.2210.
- Long green body with little to no lower shadow.
You can interpret this to mean that bears were confident, but bulls took control, and the reversal sentiment will be confirmed by strong close
Bearish Example (at the end of an uptrend):
- Candle opens at 1.2540 (gapping above previous close).
- Closes at 1.2395.
- Long red body with little or no upper shadow
This means that buyers failed to sustain gains, and rather that sellers overpowered the session. In both cases, the gap followed by a single dominant candle signals a sharp sentiment shift — often a precursor to broader reversal moves.
How to Identify the Belt Hold Candlestick Pattern?
Identifying the Belt Hold pattern involves analyzing the candlestick’s position within the prevailing trend and its specific characteristics:
- Trend context: The pattern should appear within a well-established trend—downtrend for Bullish Belt Hold and uptrend for Bearish Belt Hold.
- Candlestick features:
- Bullish Belt Hold: A long green candlestick that opens at the session’s low and closes near the high, with no lower shadow.
- Bearish Belt Hold: A long red candlestick that opens at the session’s high and closes near the low, with no upper shadow.
- Volume confirmation: Higher-than-average trading volume during the formation of the Belt Hold pattern can add credibility to the potential reversal signal.
- Gap: Should ideally gap away from the prior candle’s close, though this is more common in volatile markets.
- No significant shadow: One side (the opening side) must be clean — showing no attempt at reversal once the session began.
A key feature of this pattern is the full-bodied dominance of one side and gap appearance, making this stand out as a strong reversal signal.
(Learn To Trade And Read Candlestick Patterns Like A Pro)
How to Trade the Belt Hold Candlestick Pattern?
Trading the Belt Hold pattern involves a structured approach that considers the pattern’s formation, market context, and confirmation signals.
1. Find the Right Setup for the Belt Hold Candlestick Pattern
Start by identifying market conditions that support a reversal—typically near key support or resistance levels, trendlines, or Fibonacci zones. A Bullish Belt Hold is ideal after a downtrend, while a Bearish Belt Hold forms after an uptrend.
Look for confluence: If the pattern forms at a strong support zone or aligns with other patterns (e.g. Hammer, Engulfing), the likelihood of reversal increases, and look for this pattern after a strong trending move, ideally near a major technical level, such as:
- Prior swing highs/lows
- Trendline break zones
- Round-number resistance/support
The Belt Hold is particularly effective when it forms in oversold territory (for bullish setups), or in overbought zones (for bearish setups). As a visual setup, it comes as a clean, aggressive single candle that cuts through recent price structure, backed by location and context.
2. Wait for the Appearance of The Belt Hold Candlestick Pattern
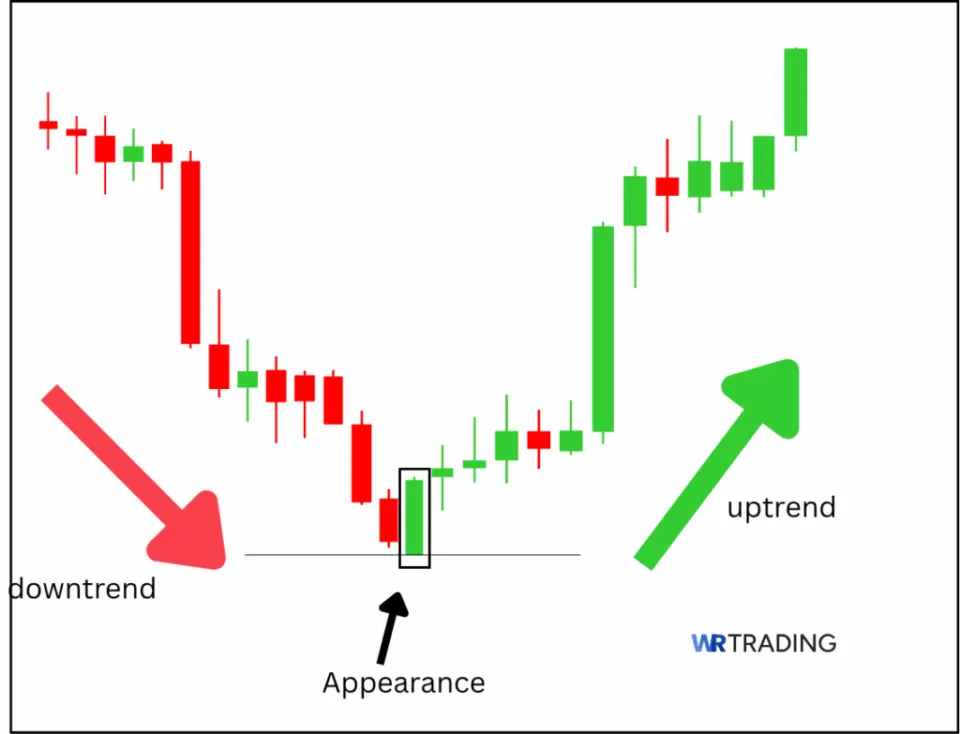
The Belt Hold pattern is a single candlestick that opens at or near the high (bullish) or low (bearish) of the session and shows no wick on one end. The body should be long, indicating strong conviction.
Wait until the candle closes, as early identification may result in false signals, nd check volume and relative candle size for strength.
3. Wait for a Confirmation or Not
Option 1: Wait for confirmation (conservative)
With this approach, you’ll wait for a second candle that breaks above (bullish) or below (bearish) the Belt Hold candle. Combine it with the RSI crossing 50 or a MACD crossover. The benefits here are that it aids conviction, and filters noise, while on the flip side, your entry might be late after the move begins
Option 2: Enter immediately (aggressive)
A more aggressive approach sees you entering on the open of the next candle, placing your stop-loss just beyond the extreme of the Belt Hold candle. The pros include this being your best R:R potential, but the downside is the lack of confirmation that translates to a higher risk.
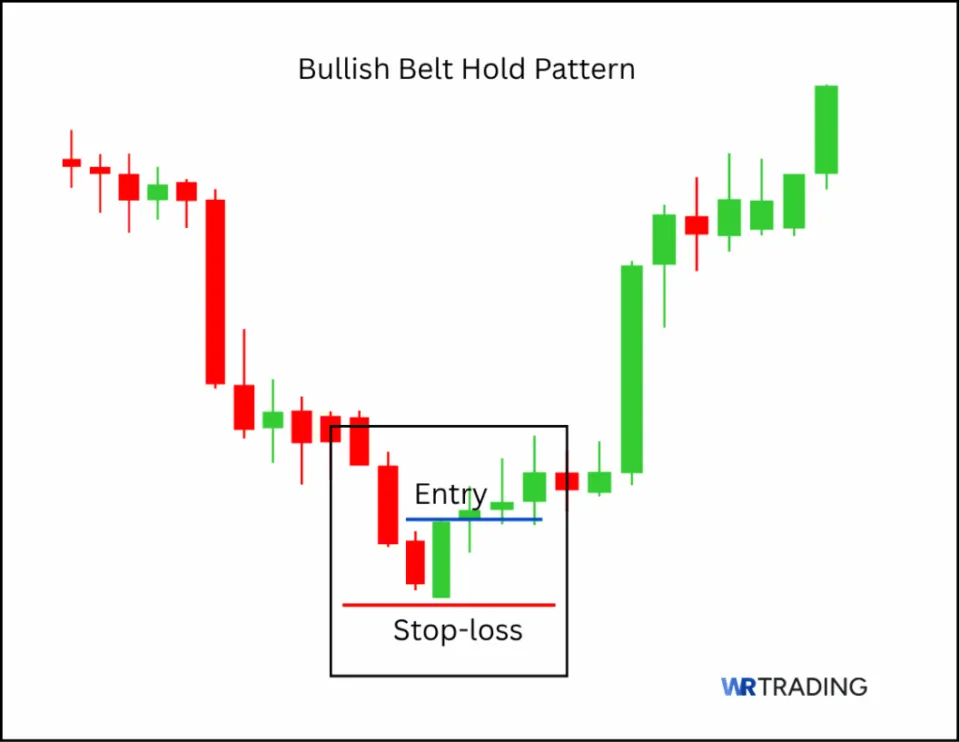
Ideal entry and risk management strategy:
- Entry: Break above/below the Belt Hold candle.
- Stop-loss: Just outside the Belt Hold’s range.
- Target: Nearest structural level or a 2:1–3:1 risk-to-reward zone.
4. Open your Trade – Entry Point
Once confirmed, open a trade in the direction of the pattern, with the stop-loss placed:
- For a Bullish Belt Hold, just below the low of the candle.
- For a Bearish Belt Hold, just above the high of the candle.
Position size should follow your risk management rules (risking no more than 1–2% per trade). Confirmation from indicators (MACD crossover, RSI divergence, or a trendline bounce) enhances the setup’s reliability.
5. Choose Your Trading Take Profit

Set your take profit level based on:
- Nearby support/resistance levels.
- Fibonacci retracements/extensions.
- Risk-reward ratio (a typical target is 2:1 or higher relative to your stop-loss).
For example, if you enter a bullish trade on USD/CHF with a 40-pip stop-loss, set your target at least 80 pips away, preferably near a previous swing high.
(Learn To Trade And Read Candlestick Patterns Like A Pro)
What are the Best Trading Strategies for the Belt Hold Candlestick Pattern?
The Belt Hold candlestick pattern can be an effective early signal of a potential market reversal, especially when used in conjunction with broader technical analysis techniques.
Below are some of the best strategies to trade this pattern, with concrete examples.
1. Trend Reversal Strategy with Confirmation
This strategy looks for the Belt Hold at the end of a strong trend (either bullish or bearish), and confirmation is required through subsequent candles or indicator alignment.
- In a strong downtrend on EUR/USD (4H chart), a Bullish Belt Hold forms.
- The next candle closes above the high of the Belt Hold.
- The RSI moves above 30, confirming bullish momentum.
- A long trade is placed with a stop-loss below the Belt Hold candle’s low, and a target at the previous swing high.
2. Support/Resistance Strategy
The pattern is traded only when it appears near key support/resistance zones, increasing the probability of success.
- On GBP/JPY daily chart, a Bearish Belt Hold appears at a long-standing resistance zone.
- Price fails to break higher after the Belt Hold, and a short trade is placed with a stop above the pattern high and a target at the next support zone.
3. Moving Average Crossover Strategy
This method uses dynamic support/resistance from moving averages to validate the pattern.
- In AUD/USD, a Bullish Belt Hold forms just above the 200 EMA on the H1 chart.
- Price closes above a short-term 20 EMA, and MACD crosses bullish.
- This confluence confirms the pattern and supports a long entry, with stop-loss just below the Belt Hold’s low.
What is the Success Rate of the Belt Hold Candlestick Pattern?
The Belt Hold candlestick pattern exhibits varying success rates from 50% to 71% depending on its bullish or bearish nature and the market context in which it appears.
According to data from LuxAlgo, the Bullish Belt Hold pattern ranks 11th out of 103 bullish reversal signals, boasting a 71% accuracy rate. Conversely, the Bearish Belt Hold pattern demonstrates a 68% success rate in bullish markets.
However, other studies, such as one by Quantified Strategies, report a 50% success rate for the Bearish Belt Hold pattern, indicating that its reliability can vary across different markets and timeframes.
The effectiveness of the Belt Hold pattern is influenced by several factors, including the prevailing trend, the presence of confirmation signals, and the specific market being analyzed. For instance, the Bullish Belt Hold pattern is more effective when it forms near support levels, while the Bearish Belt Hold pattern is more reliable near resistance levels. Additionally, combining the Belt Hold pattern with other technical indicators can enhance its predictive power.
How Accurate is the Belt Hold Pattern?
The accuracy of the Belt Hold pattern varies between its bullish and bearish forms. The bullish Belt Hold pattern has been documented to have a 71% reliability rate, making it a relatively accurate indicator of potential trend reversals.
In contrast, the bearish Belt Hold pattern’s accuracy is reported at 50% in some studies, suggesting a need for caution and additional confirmation when interpreting this pattern.
(Learn To Trade And Read Candlestick Patterns Like A Pro)
What Are the Pros and Cons of the Belt Hold Pattern?
Pros
- Clear reversal signal
- Defined entry and exit points
- Versatility
Cons
- Reliance on confirmation
- Susceptibility to false signals
- Limited predictive power in isolation
Pros:
- Clear reversal signal: The Belt Hold pattern provides a straightforward indication of potential trend reversals, aiding traders in making timely decisions.
- Defined entry and exit points: The pattern’s structure allows for the identification of precise entry and exit points, facilitating effective risk management.
- Versatility: Applicable across various timeframes and markets, the Belt Hold pattern can be integrated into diverse trading strategies.
Cons:
- Reliance on confirmation: The pattern often requires additional confirmation from other indicators or patterns to validate its signals.
- Susceptibility to false signals: In volatile or sideways markets, the Belt Hold pattern may produce misleading signals, leading to potential losses.
- Limited predictive power in isolation: Relying solely on the Belt Hold pattern without considering broader market context may reduce its effectiveness.
What are the Advantages of the Belt Hold Pattern?
The Belt Hold pattern offers several advantages that can enhance a trader’s decision-making process, including a high success rate. The bullish Belt Hold pattern’s 71% reliability rate indicates a strong potential for accurately predicting trend reversals.
The pattern’s clear structure allows you to set well-defined stop-loss and take-profit levels, enhancing risk management strategies, while also giving you enhanced market timing (by signaling potential trend reversals, the Belt Hold pattern aids traders in entering or exiting positions at opportune moments).
What are the Disadvantages of the Belt Hold Pattern?
Despite its benefits, the Belt Hold pattern has certain limitations, first among them being its dependence on market context. The pattern’s effectiveness can diminish in choppy or range-bound markets, where price movements lack clear direction.
It also comes with a requirement for additional indicators. To confirm its signals, the Belt Hold pattern often needs to be used in conjunction with other technical indicators, adding complexity to the analysis.
There is the potential for misinterpretation (you can misidentify the pattern), leading to incorrect trading decisions.
Can the Belt Hold Candlestick Pattern Have Failure Signals?
Yes, the Belt Hold pattern can produce failure signals, particularly in volatile or uncertain market conditions. False signals may occur when the pattern suggests a trend reversal that does not materialize, leading to potential losses.
To mitigate this risk, you should seek confirmation from other technical indicators or patterns before acting on a Belt Hold signal. Additionally, understanding the market context and employing sound risk management practices can help in managing potential failures.
Which Indicators can be combined with the Belt Hold Pattern?
To enhance the reliability of the Belt Hold pattern, traders often combine it with other technical indicators:
- Moving Averages: Using moving averages can help identify the overall trend, providing context for the Belt Hold pattern’s signals.
- Relative Strength Index (RSI): The RSI can indicate overbought or oversold conditions, offering additional confirmation for potential reversals signaled by the Belt Hold pattern.
- Volume analysis: Analyzing trading volume can validate the strength of the pattern, as significant volume during the formation of a Belt Hold pattern may indicate stronger conviction.
- Support and Resistance Levels: Identifying key support and resistance levels can provide context for the pattern, enhancing its predictive power.
- ADX: Use ADX > 25 to confirm trend strength if continuation follows.
Tip: The Belt Hold works best when multiple confirmations align — don’t rely on it alone.
(Learn To Trade And Read Candlestick Patterns Like A Pro)
What are the Alternatives to the Belt Hold Pattern?
If you’re seeking alternative candlestick patterns for identifying potential trend reversals may consider the following:
| Pattern Name | Description |
|---|---|
| Engulfing Pattern | A pattern of two candles that sees the second candle completely engulfing the first, showing a potential reversal. |
| Hammer | A single candle with a small body and long lower shadow, suggesting a potential bullish reversal after a downtrend. |
| Shooting Star | A single candle with a small body and long upper shadow, indicating a potential bearish reversal after an uptrend. |
| Morning Star | A three-candle pattern signaling a potential bullish reversal. |
| Evening Star | A three-candle pattern indicating a potential bearish reversal. |
See more candlestick patterns in our free Candlestick Patterns Bible PDF.
What is the Difference Between the Belt Hold Pattern and the Mat Hold Pattern?
While both the Belt Hold and Mat Hold patterns are used to identify potential trend reversals, they differ in structure and implications:
- Belt Hold Pattern: A single-candle pattern indicating a potential reversal, characterized by a long body with little to no shadows.
- Mat Hold Pattern: A multi-candle pattern suggesting a continuation of the current trend, involving a series of candles with specific formations.
| Feature | Belt Hold Pattern | Mat Hold Pattern |
|---|---|---|
| Number of Candles | Single | Multiple |
| Type | Reversal | Continuation |
| Structure | Long body with minimal shadows | Series of candles with specific formations |
| Implication | Potential trend reversal | Continuation of current trend |
What are the Limitations of the Belt Hold Pattern?
Despite its utility, the Belt Hold pattern has certain limitations:
- False signals: The pattern may produce false signals, especially in volatile or sideways markets.
- Need for Confirmation: Reliance on additional indicators or patterns is often necessary to confirm the Belt Hold signal.
- Market dependency: The pattern’s effectiveness can vary across different markets and timeframes.
- Subjectivity: Interpreting the pattern may involve a degree of subjectivity, leading to inconsistent analyses.
Learn Pattern Trading with WR Trading Mentoring
Enhance your trading skills and deepen your understanding of candlestick patterns with WR Trading’s comprehensive mentoring programs. Our expert-led courses are designed to equip you with the knowledge and tools necessary to navigate the complexities of financial markets confidently.
Join us at WR Trading and take the first step towards finally mastering the art of pattern trading.
(Learn To Trade And Read Candlestick Patterns Like A Pro)
Conclusion: Harnessing the Belt Hold Pattern in Trading
The Belt Hold candlestick pattern serves as a valuable tool in a trader’s arsenal, offering insights into potential trend reversals. Its clear structure and the ability to provide defined entry and exit points make it appealing to both novice and experienced traders.
However, as with any other technical analysis tool, you should never be satisfied to use it as a standalone indicator. Combining the Belt Hold pattern with other indicators and a thorough understanding of market context enhances its effectiveness.
From our experience, traders who integrate the Belt Hold pattern into a comprehensive trading strategy, supported by sound risk management practices, are repeatedly better positioned to capitalize on market opportunities and generate an overall profitability.