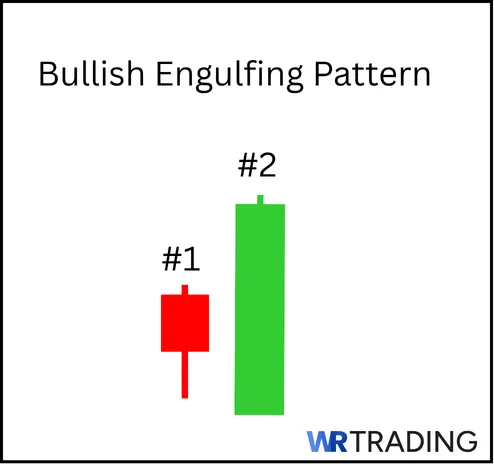
The Bullish Engulfing Candlestick Pattern is a classic two-bar reversal signal that traders use to catch shifts from selling pressure to fresh buying momentum. This setup forms when a small red (bear) candle is fully covered by the next green (bull) candle’s body, showing that buyers have stepped in with force to reverse the prior downtrend.
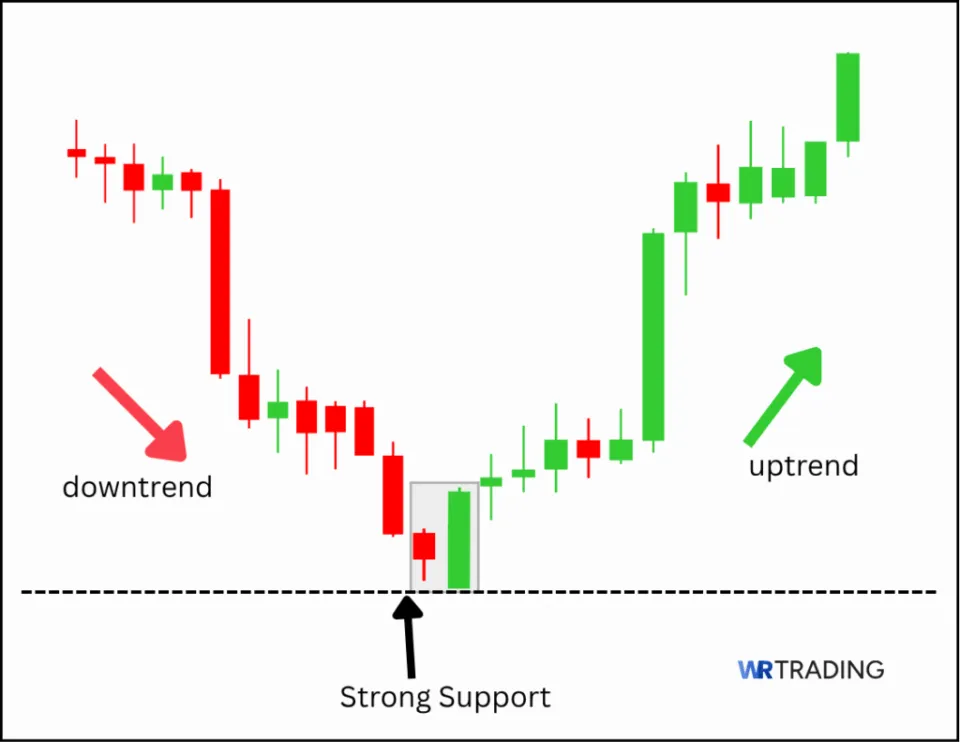
Visually, after the small bear candle closes, price gaps down slightly and prints the open of the next green candle. Price may trade a little lower on that candle to form a low before rallying to close well above the high of the former bear candle. Typically, we trade this pattern when it appears on ideal support or resistance levels, or any other structurally significant level.
The entry point for this pattern is a few pips above the high of the engulfing candle, while the stop-loss is placed some pips below the low of the engulfing candle. In this guide, we’ll cover real examples, step-by-step setup instructions, and smart ways to improve the pattern’s accuracy with trusted indicators.
Key Facts about how the Bullish Engulfing Candlestick Pattern is formed:
- Type of Pattern: Bullish reversal
- Construction:
- First Candle: Small or medium bearish candle
- Second Candle: A Larger bullish candle that fully engulfs the first candle’s body
- Trend Prior to Pattern: Established downtrend or pullback
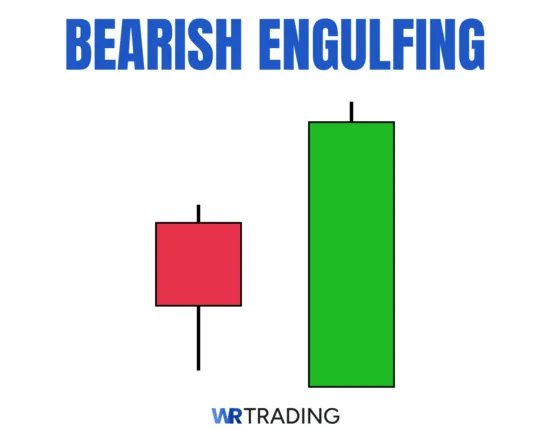
- Opposite Pattern: Bearish Engulfing Pattern
- Entry Options: Entry above the high of the green candle for a clean setup
- Stop-Loss Placement: Just below the low of the engulfing candle
- Success Rate: Between 63%–67%
- Interpretation: A strong sign that buyers have reclaimed control at a significant price level
(Learn To Trade And Read Candlestick Patterns Like A Pro)
How Is The Bullish Engulfing Pattern Formed?
The Bullish Engulfing pattern forms on a price chart when a small red candle is immediately followed by a larger green candle that wraps around the red candle’s entire body. This shift must appear during an existing downtrend or after a short pullback within a broader uptrend. It has no value in a sideways market.

This pattern needs exactly two candles to complete. The first candle reflects continued selling pressure. The second candle opens lower than the first candle’s close but closes higher than the first candle’s open. This gap and full body engulfment signal a strong reversal attempt.
On most charts, a Bullish Engulfing can appear on any timeframe, from 1-hour forex charts to daily stock charts. We find it more reliable on the 4H and Daily timeframes, where price structure is clearer and noise is reduced.
What Does The Bullish Engulfing Candlestick Pattern Mean?
The Bullish Engulfing Pattern shows a clear power shift from sellers to buyers. The first candle reflects steady selling that pushes price lower in a downtrend. In the next session, buyers step in aggressively, driving price higher and covering the entire range of the previous red candle. This two-candlestick pattern can also form when sellers aggressively exit trades, leaving buyers to dominate the next session (bullish candle).
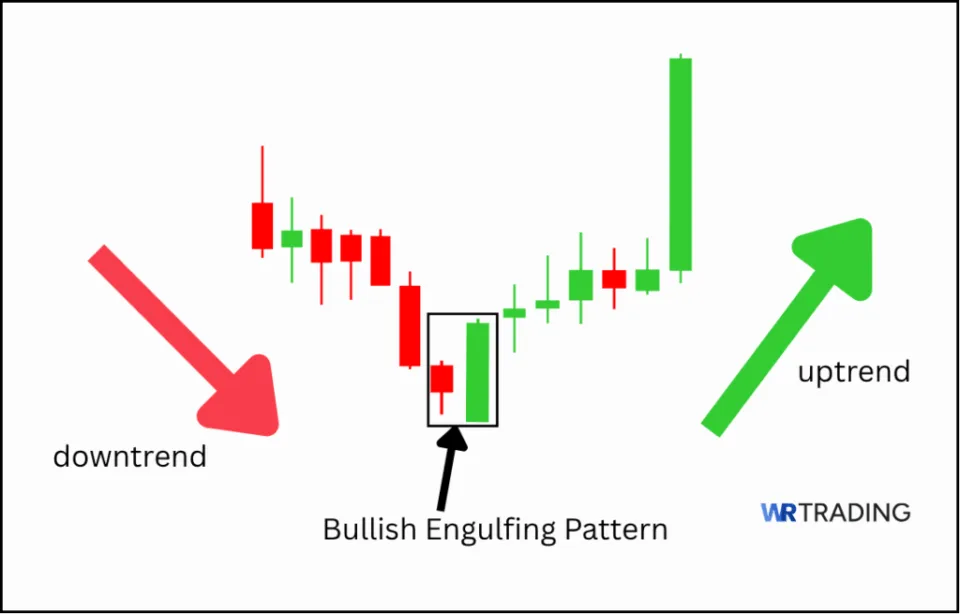
This shift in control often signals that sellers are losing momentum and that buyers are ready to push for a possible reversal into an uptrend. The psychology is simple: traders see the strong green candle engulf the red one and read it as proof that buying strength now outweighs selling pressure. This is why many traders watch for this pattern near support levels, where fresh buying demand usually appears.
Where Does the Name of the Bullish Engulfing Pattern Come From?
The pattern gets its name from how the larger green candle completely engulfs the body of the smaller red candle before it. The full engulfing makes this signal stand out. As such, even beginners can easily spot it as a clear sign of a possible reversal.
(Learn To Trade And Read Candlestick Patterns Like A Pro)
What Is An Example Of The Bullish Engulfing Candlestick Pattern?
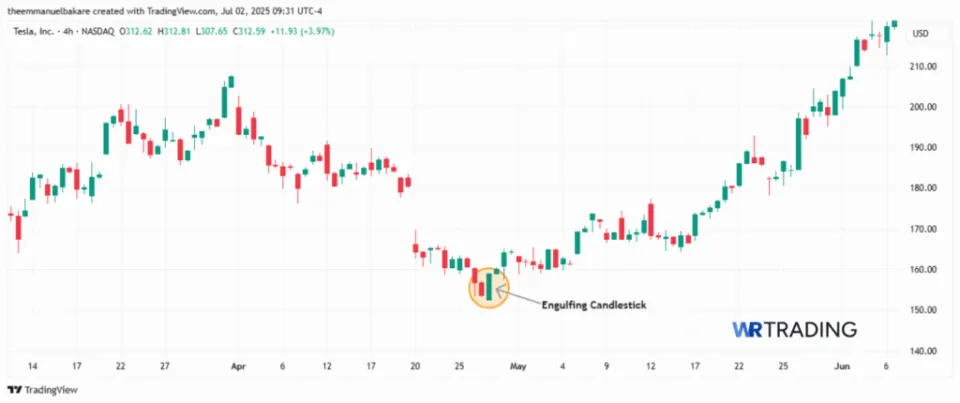
A clear example of the Bullish Engulfing Pattern occurred on the TSLA 4H chart on April 27, 2023, at 9.30 am New York time. On April 26, 1:30 am, the stock was in a short-term downtrend and formed a red candle that opened at 156.83 and closed lower at 153.64, showing steady selling.
On April 27, price opened even lower at 152.60, then buyers stepped in hard and drove the session to close at 159.03, fully engulfing the previous day’s red candle body. After this pattern formed, TSLA rallied to test 221.28, confirming the reversal.
How To Identify The Bullish Engulfing Pattern
To spot a Bullish Engulfing Pattern correctly, traders must check the market’s structure first. The pattern only matters when it appears during a clear downtrend or after a retracement in an overall uptrend. We never trade this signal in sideways or choppy conditions; it loses meaning without trend context.
Look for a small or medium red candle that shows selling is still active. This candle should have a solid body with minimal wicks. The next candle must open below the first candle’s close and close well above the first candle’s open. The body of the green candle must fully engulf the red candle’s body; shadows or wicks do not matter for the engulfing rule, only the bodies count.
A Bullish Engulfing appearing at a tested level with structure behind it is more reliable than one floating in the middle of nowhere. The best timeframes for spotting and using this pattern are the 4H and Daily charts. They filter out noise and show whether the engulfing is strong enough to signify real buyer commitment.
(Learn To Trade And Read Candlestick Patterns Like A Pro)
How To Trade The Bullish Engulfing Candlestick Pattern
Trading the Bullish Engulfing Pattern involves structure, timing, and having a plan for your entry, stop loss, and profit target. We treat this pattern as a reversal clue, not a blind trigger. Below is our full step-by-step method to trade it properly and improve the hit rate.
Find the Right Setup For The Bullish Engulfing
Before we ever pull the trigger, we scan the chart for a structured zone where a reversal makes sense. The Bullish Engulfing Pattern works best when price is reacting at:
- A clear support level that has been tested multiple times
- A key swing low in an active downtrend
- A Fibonacci retracement level like 0.382, 0.5, or 0.618
- Major psychological levels or round numbers that traders watch
- Previous resistance turned into support after a breakout.
We never trade this pattern in isolation. A Bullish Engulfing forming in the middle of nowhere rarely works. The stronger the structure, the better the setup.
1. Wait For The Appearance Of The Bullish Engulfing Candlestick Pattern
Once we find a good zone, we wait for price to appear and react. A proper Bullish Engulfing requires patience:
- The first candle should be red and ideally show clear selling, with a solid body and small wicks.
- The second candle should be green, open below the first candle’s close, and close above the first candle’s open.
- The bigger the engulfing body, the stronger the reversal signal.
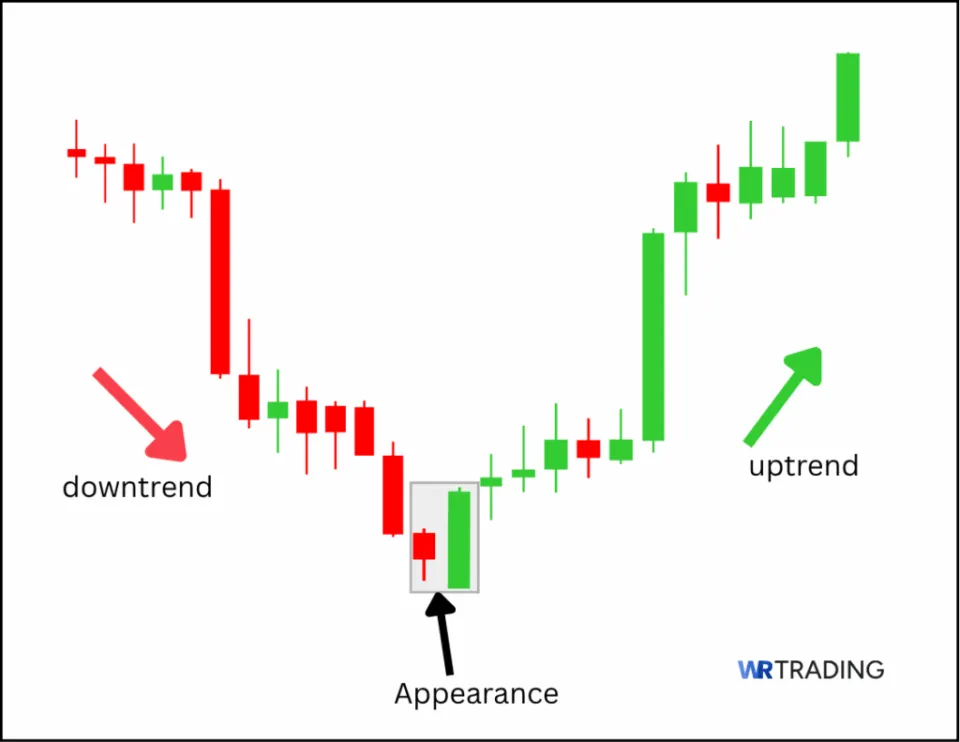
With these characteristics formed, we are ready for the next step. This discipline keeps us out of sloppy signals.
2. Open Your Trade – Entry Point
When the second candle closes and the engulfing is valid, we plan the entry and stop loss. We have two approaches:
- Aggressive Entry: Enter right at the close of the engulfing candle.
- Conservative Entry: Wait for price to retrace to the high of the red candle for extra confirmation.
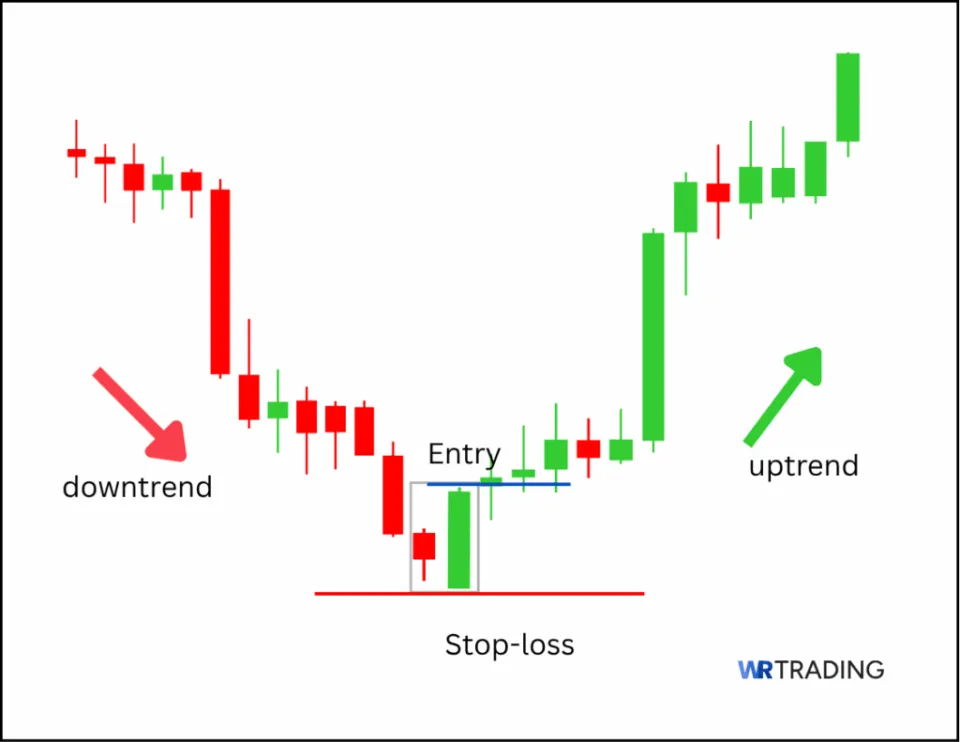
Place the stop loss a few pips below the low of the engulfing candle’s wick. Position sizing is key. We risk no more than 1% – 2% of our trading capital per trade. The lot size depends on the distance between the entry and stop loss. This keeps losses manageable if the pattern fails.
3. Wait For A Confirmation Or Not
Not every Bullish Engulfing Pattern needs more confirmation. We decide when confirmation is necessary based on how clean the setup looks. Whenever the engulfing forms on a solid structure with obvious rejection wicks, we skip extra confirmation.
When the chart is messy or the rejection level is minor, we prefer an added signal before going in fully. This can reduce false breakouts and improve the pattern’s accuracy.
What Are Confirmation Signals For The Bullish Engulfing Pattern?
We use these common confirmations to back up the pattern:
- Volume Spike: Higher-than-average volume during or right after the engulfing candle. Rising volume means real buyers are stepping in.
- Break of Minor Resistance: When price breaks above a small intraday resistance after the engulfing forms, it shows follow-through.
- RSI Crossover: The RSI (14) crosses above 50, showing momentum is flipping bullish
- Pin Bar or Doji After Engulfing: An extra candle showing rejection adds weight to the reversal.
We don’t stack too many confirmations; just one or two solid signs are enough. Overloading the chart can make good trades too complicated.
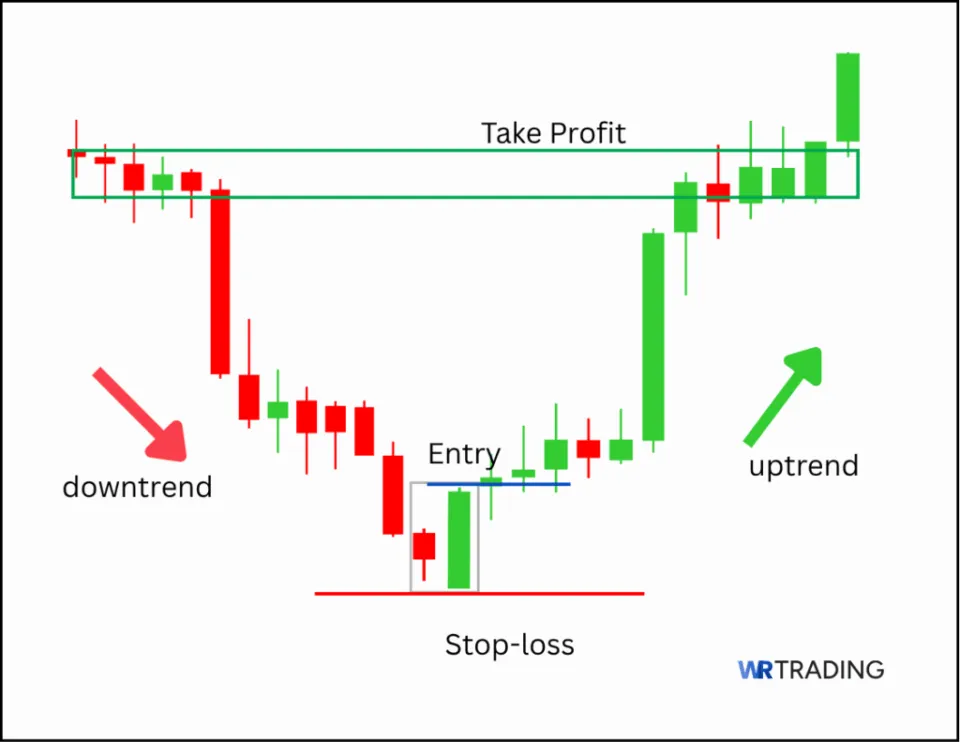
4. Choose Your Trading Take Profit
Knowing when to exit is just as important as when to enter. We never guess our target; we plan it. Before entering, we map out clear levels:
- TP1 (Target 1): The nearest swing high or resistance zone above the entry.
- TP2 (Target 2): The next major structure level or wing high.
- Trailing Exit: Suppose price moves in our favor, we can trail the stop below higher lows to lock in gains.
(Learn To Trade And Read Candlestick Patterns Like A Pro)
Which Strategies Can Be Used For The Bullish Engulfing Candlestick Pattern?
A Bullish Engulfing Pattern by itself is a useful signal, but combining it with proven strategies makes it far more accurate and practical. At WR Trading, we use the following methods to filter out weak setups and trade only where the pattern makes sense. Below are key strategies that work well with the Bullish Engulfing:
Support and Resistance Strategy
This is the core method we use daily.
- How It Works: Wait for the Bullish Engulfing to form at a strong support zone, an area where price has reacted multiple times before.
- Why It Matters: A clear support zone means buyers are defending the level, adding weight to the engulfing signal.
- Execution Tip: Mark support levels using previous swing lows or major horizontal levels on the 4H or Daily chart.
Volume-Based Confirmation Strategy
Volume is a critical filter for false signals.
- How It Works: When a Bullish Engulfing forms with a spike in volume, it confirms that real buyers are stepping in.
- Why It Matters: Low-volume engulfings are often traps. High volume during or after the engulfing shows commitment.
- Execution Tip: Compare the engulfing candle’s volume to the last 10 candles to spot a clear surge.
Breakout Strategy
The engulfing candle can act as a launchpad for breakouts.
- How It Works: Use the Bullish Engulfing as an early clue before a breakout of minor resistance.
- Why It Matters: This strategy sets up momentum trades that continue once price clears the next barrier.
- Execution Tip: Wait for price to close above the engulfing candle’s high and the nearby resistance before entering.
News-Based Strategy
Sometimes fundamentals push patterns to work better.
- How It Works: Trade the Bullish Engulfing only if it forms around major news events that match the reversal idea.
- Why It Matters: News can provide the catalyst for buyers to overpower sellers and push price into a fresh uptrend.
- Execution Tip: Align the engulfing pattern with economic calendar releases or big earnings reports in stocks.
Combining these methods with the Bullish Engulfing Pattern helps improve its hit rate and filters out setups that look good but lack solid backing.
(Learn To Trade And Read Candlestick Patterns Like A Pro)
What Is The Success Rate Of The Bullish Engulfing Candlestick Pattern?
The Bullish Engulfing Pattern has a typical win rate of about 63% – 67%. In Thomas Bulkowski’s research on classic candlestick patterns, he explained how this pattern consistently shows moderate accuracy as a reversal clue when combined with trend context and volume.
Its accuracy depends on clear market structure, solid support levels, and clean price action. Trading this pattern in the middle of a range or low-volume area drops the hit rate sharply. At WR Trading, our trade logs confirmed these stats and showed that using the Bullish Engulfing together with volume spikes, momentum indicators, or Fibonacci levels improves its reliability.
Is the Bullish Engulfing a Reliable Candlestick Pattern?
Yes. When used in the right chart context with structure and confirmation, the Bullish Engulfing Pattern can be one of the most reliable and clear entry signals for reversal traders.
Is the Bullish Engulfing Candlestick Pattern Suitable For Beginners?
Yes, the bullish engulfing pattern is a perfect pattern for beginners because it consists of only two candles. It’s easy to sight and doesn’t involve calculations to figure out what’s happening between buyers and sellers.
Most people consider it a simple way to learn about how psychology affects price action. But the biggest challenge is using it at the wrong time. New traders who recognize the pattern might disregard the larger trend and trade it in noisy, choppy markets.
What Are The Pros And Cons Of the Bullish Engulfing Pattern?
Pros
- It is a simple two-candle setup.
- It is easy to spot on charts.
- It works well on 4H and Daily timeframes.
- Clear entry and stop placement.
- It can be combined with volume or indicators.
Cons
- It can fail in sideways markets.
- It loses accuracy without structure.
- It is not strong without confirmation.
- It can produce false signals in low-volume conditions.
- Beginners may misuse it without context.
When Can The Bullish Engulfing Have Failure Signals?
Yes, the Bullish Engulfing Pattern can fail when:
- It forms inside a sideways range without a clear trend. For example, if EUR/USD is stuck between tight support and resistance and prints an engulfing in the middle, there’s no strong reversal context.
- Volume is low; a weak engulfing without real buying behind it often stalls.
- Engulfing happens at minor levels instead of key zones.
What Are The Limitations Of The Bullish Engulfing Pattern?
Some clear limitations to watch for include:
- Reliance on Trend: Without an existing downtrend or clear pullback, the pattern loses meaning.
- Needs Confirmation: On its own, it’s not enough; volume or indicators add confidence.
- Not Foolproof: Even the cleanest setup can fail; no pattern has a 100% success rate.
- Failure in Ranges: In choppy or sideways markets, the engulfing often gives false signals.
- Candlestick Size: A tiny engulfing candle compared to the previous trend is weak and easy to ignore.
Which Indicators Can Be Combined With The Bullish Engulfing To Increase Its Success?
We combine the Bullish Engulfing Pattern with these trusted tools to boost accuracy:
- RSI (14): Look for RSI crossing above 50 after the engulfing forms. This shows momentum switching to bullish.
- MACD (12, 26, 9): A fresh bullish crossover near zero can confirm buyers are stepping in.
- Volume: Use standard volume or a volume profile to spot spikes during or right after the engulfing. Higher volume means real participation
- Fibonacci Retracement: Whenever the pattern appears near the 0.382, 0.5, or 0.618 levels, it aligns well with natural reversal points.
We rarely rely on just one tool. Our combination of structure, volume, and a clear engulfing gives this classic pattern its real trading edge.
What Are Similar Patterns To The Bullish Engulfing Pattern?
Several candlestick patterns share the same reversal idea as the Bullish Engulfing. Here are a few types that traders should know:
- Piercing Line: A two-candle bullish reversal where the green candle closes above the midpoint of the previous red candle’s body.
- Morning Star: A three-candle bullish reversal showing a big red candle, a small indecision candle, and then a strong green candle closing above the midpoint.
- Hammer: A single candle with a small body and long lower wick found at the bottom of a downtrend, showing rejection of lower prices.
- Bullish Harami: A smaller green candle contained within a larger previous red candle’s body, hinting at possible trend exhaustion.
These patterns work best near support levels, just like the Bullish Engulfing. See more patterns in our free Candlesticks Patterns PDF for Traders.
What Is The Opposite Pattern Of The Bullish Engulfing?
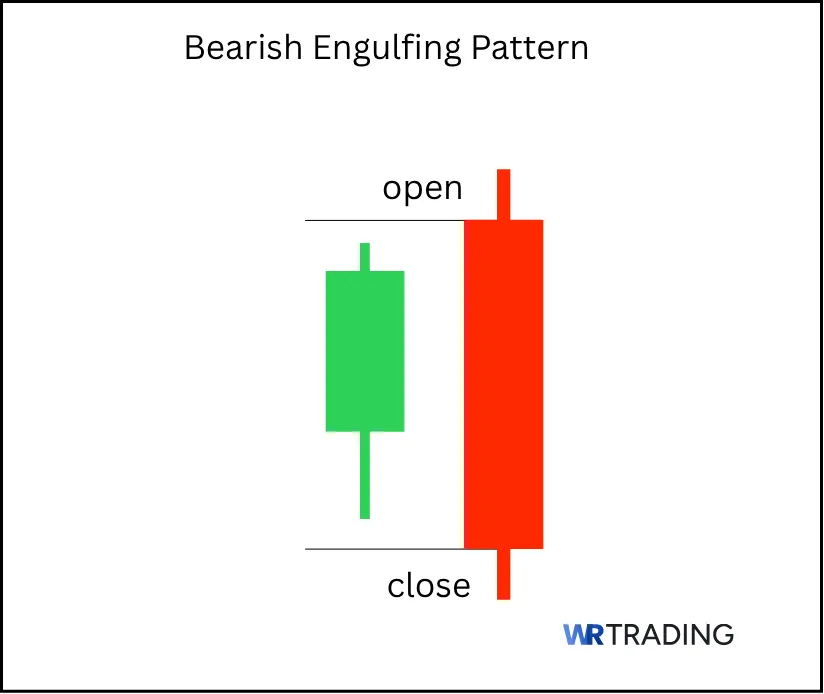
The opposite of the bullish engulfing pattern is the Bearish Engulfing Pattern. It forms at the top of an uptrend when a small green candle is followed by a larger red candle that fully engulfs it, showing sellers stepping in to flip the momentum downward.
(Learn To Trade And Read Candlestick Patterns Like A Pro)
What Is The Difference Between The Bullish Engulfing and Bearish Engulfing Candle patterns?
Both patterns use the same engulfing concept but appear in opposite trends and point in opposite directions. While the Bullish Engulfing signals the end of selling, the Bearish Engulfing warns that buying may be exhausted.
| Feature | Bullish Engulfing | Bearish Engulfing |
|---|---|---|
| Trend Prior | Downtrend | Uptrend |
| First Candle | Red/small | Green/small |
| Second Candle | Green/larger | Red/larger |
| Signal | Bullish reversal | Bearish reversal |
| Psychology | Buyers overpower sellers | Sellers overpower buyers |
What Is The Difference Between The Bearish Engulfing And Bullish Harami Candle Pattern?
The Bearish Engulfing is an aggressive reversal signal that shows sellers taking full control by covering the prior bullish candle completely. In contrast, the Bullish Harami is more subtle; the small green candle sits inside the previous red candle’s body, hinting at possible selling exhaustion but without the same pressure of the engulfing. Traders often see the engulfing as stronger and more direct than the Harami.
What Is The Difference Between The Bullish Engulfing And Piercing Line Candle Pattern?
The Piercing Line and the bullish engulfing are similar alternatives. The piercing line appears after a downtrend with a strong red candle, then a green candle that opens lower but closes above the midpoint of the red candle, showing that buyers are reclaiming ground fast. It is similar but not quite the same as the bullish engulfing.
Learn Pattern Trading With The WR Trading Mentoring
At WR Trading, we don’t just teach textbook patterns; we train traders to spot setups like the Bullish Engulfing where they matter most. Our mentoring shows you how to utilize these candlestick signals with structure, confirmation, and risk control. Simply put, for everyone looking to turn these patterns into practical trades, our step-by-step system is the way to go.
(Learn To Trade And Read Candlestick Patterns Like A Pro)
Conclusion: Use the Bullish Engulfing Pattern as a Tested Reversal Tool
The Bullish Engulfing Pattern is a straightforward yet powerful way to spot potential turning points in a market that has been pushing lower. To trade it, you need to look for the pattern at key support levels, swing lows, or major retracement zones where reversals occur. For us at WR Trading, we look for the pattern when price reaches strong support or key levels, placing our entry and stop loss just above and below the high and low of the engulfing candle, respectively.
In our experience, the pattern alone is never enough. The right context, volume confirmation, and structure separate a random engulfing from a high-probability reversal. Beginners will find it easy to spot. As such, the Bullish Engulfing can be a truly reliable and profitable tool for technical analysis, but only when matched with discipline and proper risk control.