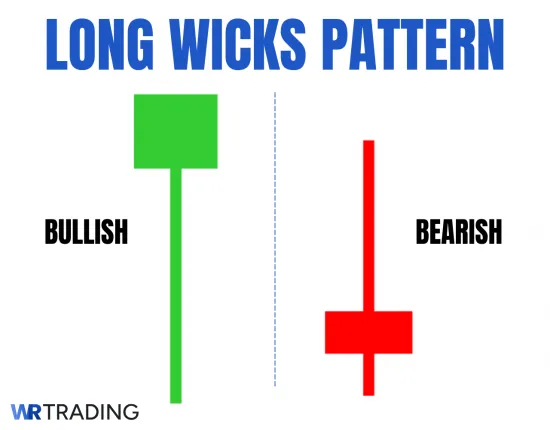
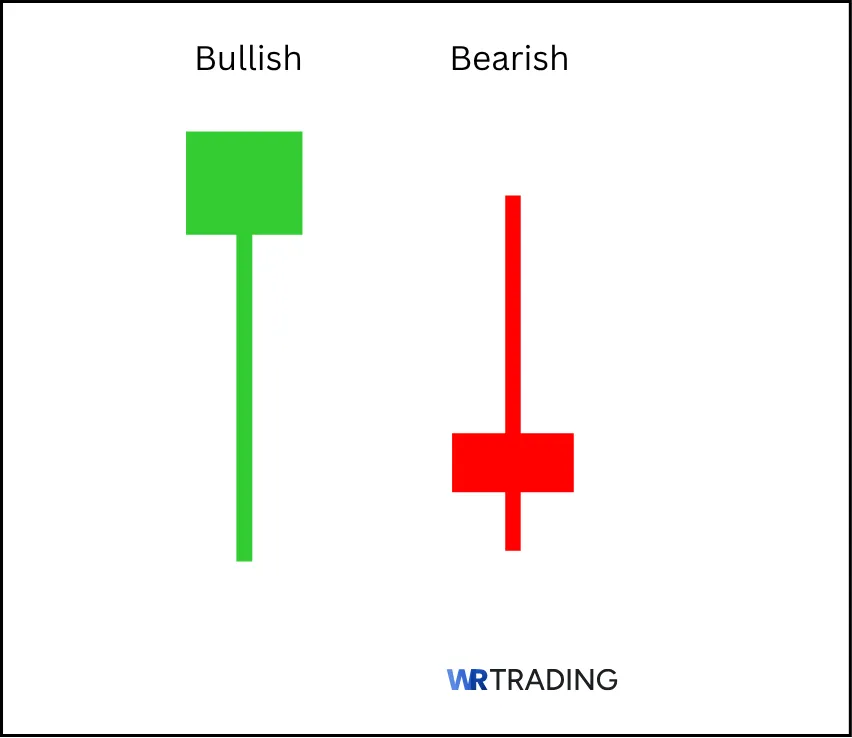
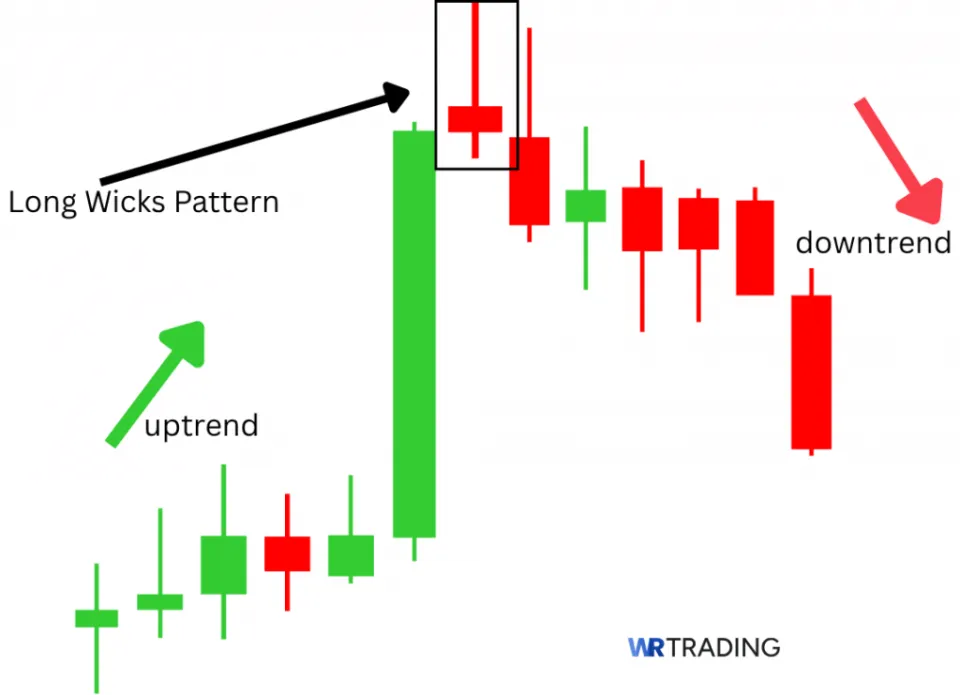
A long wick candlestick pattern refers to any candle where the shadow or wick is much longer than the body. They form during an uptrend or in downtrend conditions and often signify exhaustion and price rejection.
We have seen many traders in markets like forex use long wicks, like hammer, shooting star, and pin bar, as powerful price action cues.
In this guide, the meaning behind long wicks will be clearly explained, supported by various examples and practical strategy ideas. We’ll also cover which methods increase their reliability, how accurate they tend to be, and how traders fit them into broader systems.
How The Long Wicks Candlestick Pattern Is Structured:
- Main Candle: Small body with long shadow (at least 2-3x the size of body)
- Type Of Pattern: Trend continuation/reversal
- Types of Long Wick Candles: hammer, inverted hammer; hanging man, shooting star, spinning top
- Trend Prior The Pattern: Bullish or bearish
- Entry Options: after confirmation candle; on a pullback; with an indicator; on the close of long wick candle
- Stop-Loss Placement: outside the long wick
- Psychology: rejection signal
- Success Rate: 53-65%
(Learn To Trade And Read Candlestick Patterns Like A Pro)
How Is The Long Wicks Pattern Formed?
A long wick candle forms when the price moves in one direction during most of a trading session but then pulls back sharply before the candle closes. Initially, the candle is full-bodied until much of its body is consumed at the end, replaced by a long wick.
We primarily see:
- Bullish long wick candlestick patterns (where the price initially went down but was quickly reversed and produced a small green-coloured candle)
- Bearish long wick candlestick patterns (where the market initially went down but was quickly reversed and produced a small red-coloured candle)
Long wick candles can appear in all market conditions across all time frames. Traders should wait for at least one candle afterwards to confirm the signal.
Which Type Of Long Wicks Candlestick Patterns Exist?
The most common types of long wick candle patterns include the hanging man/hammer, shooting star/inverted hammer, and pin bar. These are quite similar, with subtle differences between them:
- Hanging man / Hammer: The hanging man has a long lower wick and, most importantly, a small green/red body with no upper wick. It forms at the end of an upward movement and is, hence, a bearish reversal or continuation pattern.
Meanwhile, the hammer is identical to the hanging man. The main difference is that it forms at the end of a downward movement, making it a bullish reversal or continuation pattern.
Traders can become even more confused since each candle can be either red or green-coloured. However, the most critical differentiators are where they form.
- Inverted Hammer / Shooting star: The inverted hammer is the opposite of the hanging man, except that it’s a bullish reversal or continuation pattern. Meanwhile, the shooting star is the opposite of the hammer, apart from being a bearish reversal or continuation setup.
Note: The hanging man and shooting star are variants of the hammer, named as such because they resemble a hammer with a flat head.
- Pin bar: Thankfully, the pin bar is easier to distinguish from the other long wick candles.
While it contains a long upper or lower shadow, it stands out with its small body, which has a tiny nose-like appearance (caused by the closing prices being near the high or low price). The name refers ‘Pinocchio’s nose’ (the long version is the ‘Pinocchio bar’).
There are bullish and bearish versions of the pin bar, where the body is green and red-coloured, respectively.
- Spinning top: This pattern features a small-bodied candle centered between relatively equal long upper and lower wicks, indicating market indecision. The bullish version has a green body, while the bearish one has a red body.
(Learn To Trade And Read Candlestick Patterns Like A Pro)
What Does a Long Wick Candlestick Pattern Mean?
The long wick candlestick pattern is a rejection signal. It reflects a moment when the market pushed in one direction but was met with strong opposition, which reversed it. This is what contributes to the long shadow or wick.
When the candle has a long upper wick, it indicates that buyers were in control for most of the session. However, sellers stepped in aggressively and drove the price back down, resulting in a close near the opening price. This sudden bearish shift leaves buyers feeling uncertain or trapped, especially if they entered the market late. On the other hand, it gives sellers more confidence that the price is starting to reverse or weaken.
The opposite is true for a long lower wick. Here, sellers initially dominated, driving the price down. But eventually, buyers stepped in forcefully, pushing the price back up toward the open or even higher. This can erode confidence among sellers and signal that the market has rejected lower prices, possibly setting up a bullish shift.
What Is An Example Of A Long Wick Candle?
Let’s look at examples of long wick candles on real-life charts.
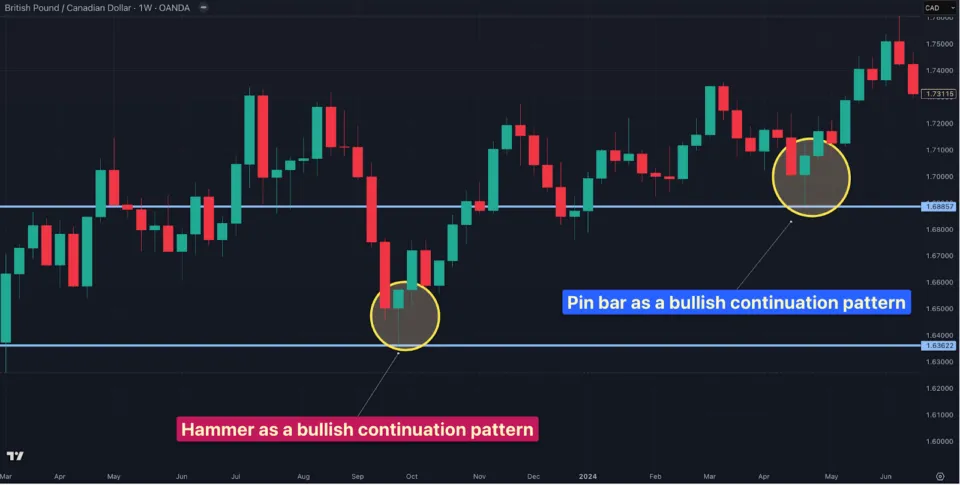
The first is on the weekly chart of GBP/CAD. Here, we have a hammer as a bullish continuation pattern around the 1.63622 level. Then, there is a pin bar also acting in the same role near the 1.68857 level.
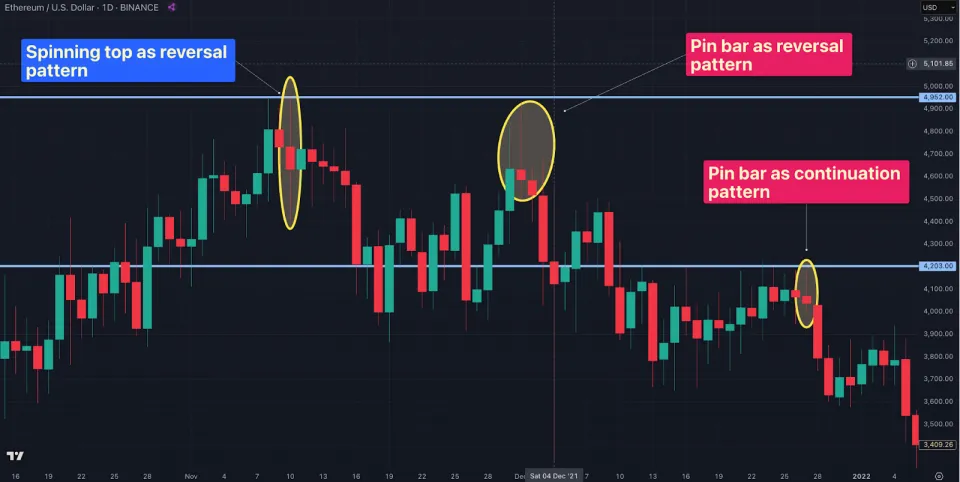
The next example is on the daily chart of Ethereum. Here, we have a red spinning top and pin bar as reversal patterns on the $4952 level, along with the pin bar as a continuation candle around $4203.
(Learn To Trade And Read Candlestick Patterns Like A Pro)
How To Identify A Long Wick Candlestick Pattern
Identifying a long wick candlestick starts with seeking optimal locations. These candles typically form at or during:
- Key support/resistance levels: horizontal levels at recent swing highs/lows are natural areas for any candle.
- Trendlines or channel boundaries: these act as ‘dynamic’ support/resistance
- Moving averages: these perform a similar role but can also provide trend confirmation
- Fibonacci retracements: deeper levels that exceed the 50% level are ideal.
- Post high-impact news: certain high-impact economic events can cause overextended moves or volatility spikes with sharp reversals, leaving long wicks
The second step is to confirm the ideal wick-to-body ratio. The wick should be at least 2-3 times the length of the body. This can be measured with a ruler on most charting platforms. The body should be a small square (for most long wick candles) or rectangular shape (for the spinning top).
Next, traders should validate the context. Candles with long wicks are most meaningful when the prior trend shows overextension, and the long wick represents an attempt to continue the trend.
For example:
- In an uptrend, a long upper wick after multiple green candles may suggest bullish exhaustion and a possible trend change..
- In a downtrend, a long lower wick after several bearish candles may indicate seller fatigue and a possible reversal.
How To Trade The Long Wick Candlestick Pattern?
Trading long wick candlestick patterns involves multiple steps:
- Find the proper market conditions
- Wait for the appearance of the pattern
- Open your trade
- Choose the trading take-profit
(Learn To Trade And Read Candlestick Patterns Like A Pro)
1. Find the Right Setup For The Long Wick Candle
Before trading, you must identify ideal market conditions where the pattern carries more weight:
- In a reversal situation, look for long wicks to align with key support/resistance zones or chart patterns
- For a trend continuation situation, long wick candles can also appear at key support/resistance zones along with recent swing highs/lows, Fibonacci levels, and trendlines.
- In a clear uptrend, look for long wicks near swing highs to signal buyer exhaustion.
- In a clear downtrend, look for them near swing lows to spot fading selling pressure.
2. Wait For The Appearance Of The Long Wick Candlestick Pattern
Having identified a long wick candle, you should first ensure that it meets the ideal wick-to-body ratio and body size. Most importantly, waiting for a follow-up candle is necessary. Traders shouldn’t act solely on a long wick candle. Once it appears, the next candle should align with the relevant direction.
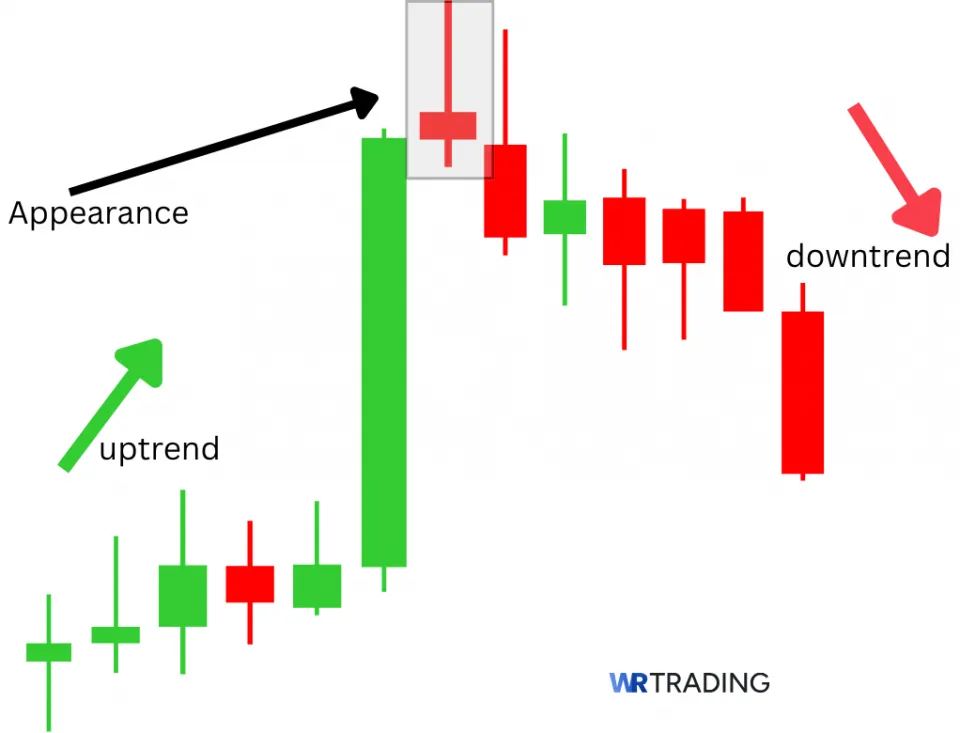
In a bullish reversal or continuation setup, you should see a bullish candle. Meanwhile, a bearish candle should appear in a bearish reversal or continuation trade.
3. Open Your Trade – Entry Point
Aside from the confirmation candle entry (where you enter after a closed follow-up candle), here are the other types of ways to enter a long wick pattern. Each of these provides similar risk (with the aggressive entry being the riskiest) and varying reward potential:
- Retracement entry: enter on a pullback (e.g., using a Fibonacci retracement) into the body of the long wick candle.
- Indicator combo entry: Combine the wick rejection with another indicator (e.g., ADX, RSI divergence, Bollinger Band extreme, volume rise, or MA bounce). Enter only if the indicator supports the wick’s signal.
- Break of the wick candle entry: Enter on the break of the high (for bullish long wick) or low (for bearish long wick) of the subsequent candle.
- Aggressive entry: enter immediately on the close of the long wick candle.
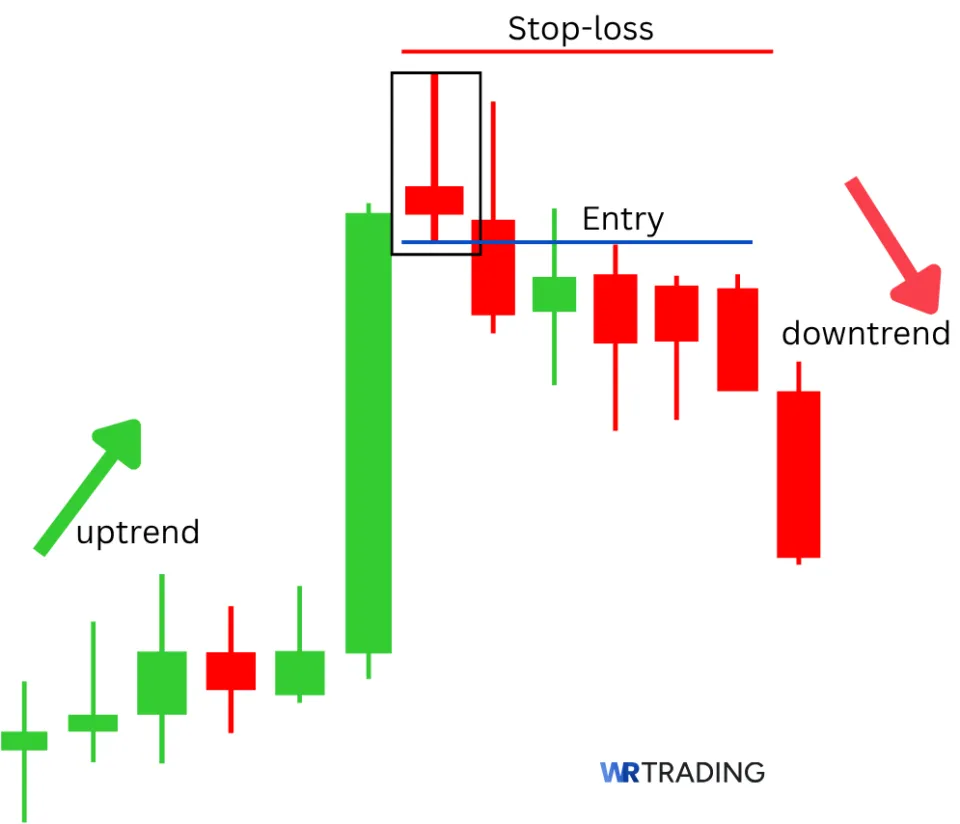
In all cases, traders should place the stop loss at the low or high of the long wick candle. You should also ensure that the stop loss distance aligns with your position size, which should not exceed 3% of the trading capital.
4. Choose Your Trading Take Profit
Once you’ve taken an entry on a long wick pattern and the trade begins to move in your favor, it’s time to think of potentially taking profits. This strategy will depend on your trading style and the unfolding market conditions, which can occur rapidly.
- Targeting key support and resistance zones: Support and resistance levels act as natural price points where the market hesitates and reacts.
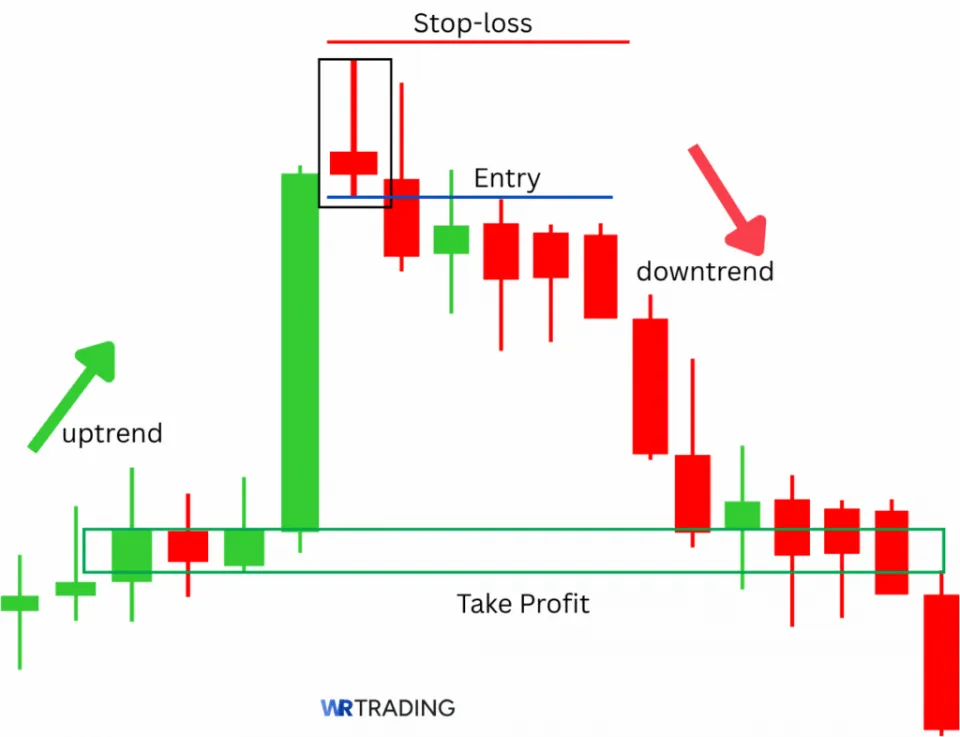
Traders typically identify these zones on higher timeframes to establish meaningful targets. If a long wick candle forms near support and price begins to rally, the next resistance area becomes a logical place to bank profits, either partially or fully (and vice versa for a long wick near resistance).
- Fibonacci: Fibonacci retracements offer precision-based profit targets. Once the long wick pattern confirms a reversal, traders can apply the Fibonacci retracement tool to the preceding price swing. Levels worth watching include 38.2%, 50%, 61.8%, and 78.6%, along with further extensions like 127.2%, 138.2%, and 161.8%.
- Trailing stop loss: Rather than aiming for a fixed target, some traders prefer to trail their stop-loss to lock in gains while allowing the trade to ‘breathe.’ This approach is ideal in strong, fluid moves where the price continues in one direction with minimal pullback. Popular trailing methods include:
- A set number of pips behind price
- A trailing stop based on the Average True Range (ATR)
- Following a moving average for dynamic support/resistance
- Scaling out: Many traders opt to scale out by taking partial profits at different price milestones. For instance, you might close 50% of your position at a 1:1 risk-reward ratio, then trail the rest toward the next resistance level. Scaling out gives you flexibility: if the market follows through only briefly before reversing, you have still captured part of the move.
- Chart pattern-based targets: Often, a long wick candle forms within a broader chart pattern, such as a double bottom, falling wedge, or bullish flag. In these cases, you can use the projected target of the larger pattern to set your take-profit level.
For example:
- If a long wick candle appears during a wedge, measure its height and project it from the breakout point.
- In a double bottom, use the distance from the lows to the neckline and project that upward for your target.
Finally, traders must ensure their trade has the potential to offer a 1:3 risk-to-reward ratio.
(Learn To Trade And Read Candlestick Patterns Like A Pro)
Chart examples
Let’s now examine a few live chart examples that incorporate all the different aspects we’ve discussed.
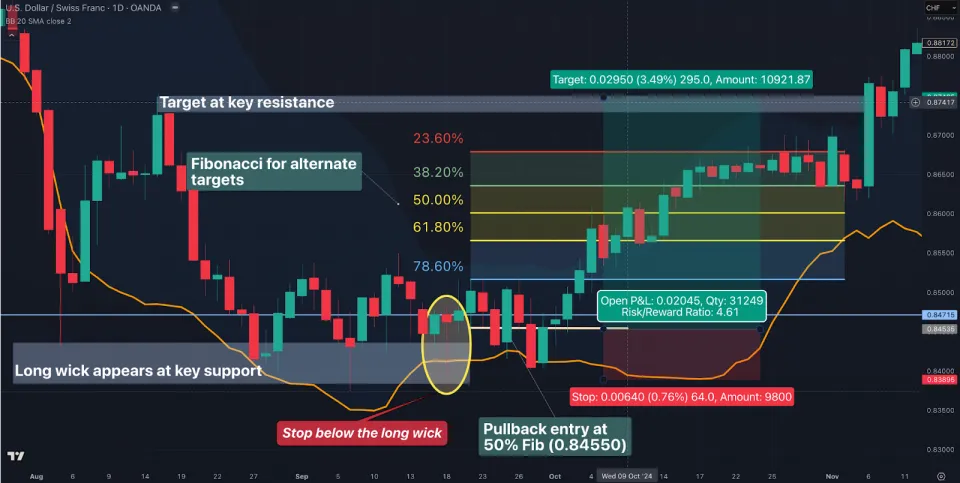
The first one is a pin bar with a remarkably long wick on the daily chart of USD/CHF. Here are the main confirmation factors of this trade:
- Pin bar formed outside of a lower Bollinger band
- It also appeared at a key resistance level
- The market offered a pullback entry, making for a favourable and less risky entry method
With an entry at 0.84550 (and a 64 stop at 0.83910), a trader would have achieved a 4.61x trade if they exit at the high of the key resistance (0.87846)
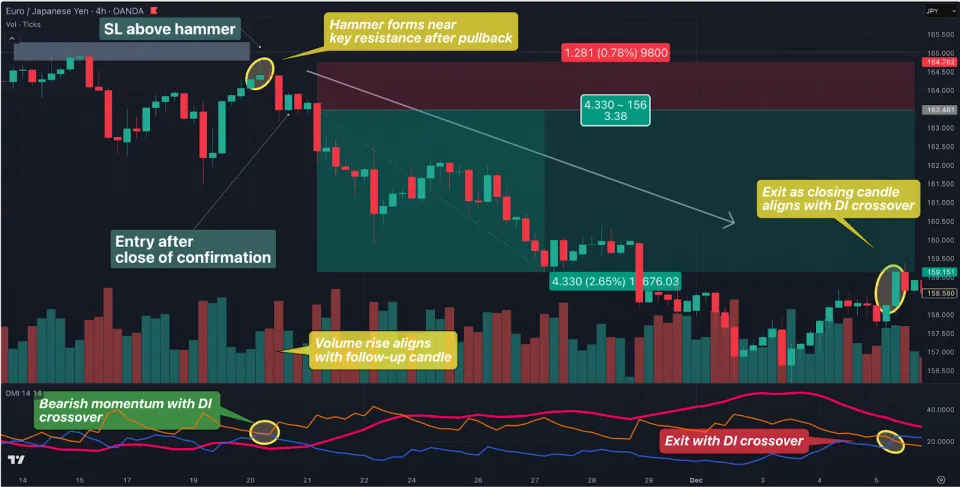
The next illustration is a hammer on the 4HR chart of EUR/JPY as a downtrend continuation. Here are some key points of this trade:
- The hammer formed near a key resistance
- Volume rose with the confirmation candle after the hammer
- A DI crossover (where the negative directional indicators crossed above the positive one) happened on the ADX
This time, one would have entered at the close of the follow-up candle, 163.481, with a stop at 164.762, the high of the hammer. The ADX could have been used as an exit signal. Here, a trader exits at the close of the bullish candle (159.151) at this crossover. The final risk-to-reward for this position would have been 3.38x.
What Is The Success Rate Of A Long Wick Candlestick Pattern?
The success rate of a long wick candlestick varies according to the type and has a range from 53% to 65%. Based on research:
- The hammer has a success rate of approximately 62% in bullish reversals (according to Brett N. Steenbarger in Journal of Futures Markets)
- The inverted hammer boasts an approximate 65% success rate (in bullish reversals), according to Corey Rosenbloom in Afraid to Trade)
- The spinning stop was found to have a success rate of about 53-54% (according to the Technical Analysis Research & Education)
These examples demonstrate that long wick patterns achieve fairly respectable accuracy. However, many factors influence their hit rate, which are all key to know when learning how to trade them:
- Market setup: Long wick candles that appear towards the end of pullbacks offer higher probability entries than reversal and range-bound markets.
- Timeframe context: Long wicks on higher timeframes (H4, daily, weekly, monthly) carry more weight and reliability. Meanwhile, lower timeframe patterns (e.g., 1-min or 5-min) can be erratic unless aligned with a higher timeframe structure.
- Support and resistance zones: Long wick candles that reject clearly defined horizontal levels (e.g., previous swing highs/lows or demand/supply zones) are generally more favourable.
- Volume confirmation: A long wick candle with increased volume suggests strong rejection by institutional participants. Meanwhile, low-volume wicks are more likely to be noise or traps.
- Confluence with other signals: Success with long wick candles increases when you combine them with several technical indicators like the Relative Strength Index, moving averages, and Bollinger Bands.
Is The Long Wicks Pattern Suitable For Beginners?
Yes, long wick candles are very beginner-friendly in our experience, laying the foundation for more complex price actions. However, there are a few challenges that beginners could face.
Firstly, long wick patterns are frequent, particularly in lower time frames. This makes it challenging to know which are the most relevant ones.
Secondly, many long wick candles are visually similar. So, this can be quite confusing without the experience to differentiate each one. The way to solve this problem is to consider the context each pattern forms, leading us to another challenge. New traders can easily act solely on seeing a pin bar or another long wick candle without other factors to support its presence.
Used well, long wick candles are foundational for technical trading. Still, they should be treated as part of a broader setup, not as a standalone magic signal.
(Learn To Trade And Read Candlestick Patterns Like A Pro)
What Are The Pros And Cons Of the Long Wick Candle Pattern?
Here is a brief summary of the pros and cons of trading a long wick candle pattern:
Pros
- Easy visual identification
- Reveals key rejection areas
- Offers natural entry and risk management structure
Cons
- Not reliable in isolation
- Frequent appearance
- Potential for delayed entry
- Subjective interpretation
What Are The Advantages Of The Long Wick Pattern?
The main pros of long wick patterns include easy visual identification, their ability to show rejection areas, and how they offer defined entry and stop loss parameters:
- Easy visual identification: Long wick candlesticks are easily recognizable. This reduces the reliance on complex indicators and helps beginners quickly improve their price action reading.
- Revelation of key rejection areas: Long wicks expose where price was forcefully rejected at key support/resistance levels. This offers powerful trading opportunities.
- Natural entry and risk management structure: Traders can enter on the break of the wick’s high/low (or use other methods) with stops beyond the wick’s end. This offers simple yet accurate entry and stop loss placements.
What Are The Disadvantages Of The Long Wick Pattern?
Equally crucial is noting the limitations of these candles, which include not being reliable in isolation, over-appearance, potential for delayed entry and subjective interpretation.
- Not reliable in isolation: Long wick candles are meaningless on their own. Without a combination of market structure and technical indicators, these setups can easily fail.
- Frequent presence: Long wick candlesticks appear frequently (particularly on lower time frames and ‘choppy’ markets). This makes it challenging to find which ones are the most worthwhile to trade.
- Potential for delayed entry: Many traders wait for a follow-up candle to validate. a long wick pattern. While this is for confirmation and to improve accuracy, you are often entering late in the trade.
- Subjective interpretation: there are no universal rules for determining wick length and body size, leading to inconsistent decision-making
Can The Long Wick Have Failure Signals?
Yes, long wick candles fail for numerous reasons like false rejections, lower time frame noise, and lack of supporting factors. Without additional context, traders should expect success rates below 50%.
Luckily, traders can explore better alternatives. These include two-candle patterns like the inside/outside bar, the harami, or three-candle patterns like the three outside down. While they are not similar to individual long wick patterns, they have better predictive power due to the presence of an additional candle.
Which Indicators Can Be Combined With The Long Wick Candle to Increase Its Success?
Here are the popular indicators to use when a long wick candle has formed to make it more effective:
Average Directional Index (ADX)
The ADX measures trend strength on a 0-100 scale and also offers hints on momentum shifts.
How it can help:
- A long wick in the direction of a rising ADX (above 20–25) suggests the trend is strengthening.
- A long wick with falling ADX after peaking (40–60) supports trend exhaustion or reversal.
Ideal setting: 14 periods (standard)
Relative Strength Index (RSI)
The RSI is a momentum indicator that shows divergence and overbought/oversold conditions
How it can help:
- Long wick candles at RSI extremes (e.g. >70 or <30) show exhaustion.
- Long wick candles with divergence offer a decent reversal probability.
Ideal setting: 14 periods (standard)
Volume
Volume indicators (like the Simple and On Balance Volume) measure the quantity of contracts for a specific market over a certain period. This provides clues on the strength of price movements.
How it can help:
- A long wick accompanied by high or rising volume indicates particularly strong rejection.
Ideal setting: this depends on the type of volume indicator
Moving averages
Moving averages are a popular indicator that confirms trend direction and dynamic support/resistance.
How it can help:
- A long wick rejecting an MA supports the possibility of a trend continuation.
Ideal settings:
- Short-term: 9 or 20 MA
- Medium-term: 50 MA
- Long-term: 100 or 200 MA
Bollinger Bands
This indicator identifies volatility extremes and mean reversion points.
How it can help:
- A long wick that pierces the outer band, especially with a close inside, often signals a reversal.
- Best used in range-bound or mean-reverting environments.
Ideal setting: 20-periods, 2 standard deviations
(Learn To Trade And Read Candlestick Patterns Like A Pro)
What Is The Difference Between Long Wick Candles And Short Wick Candles?
Long wick candles have extended upper or lower shadows (often 2–3 times the length of the body), appearing after a swift change in direction. Meanwhile, short wick candles have little to no shadows, showing firm directional conviction for a particular session.
Long wick patterns typically indicate rejection and reversals, while their counterparts are trend continuation signals.
The table below is a summarised comparison of both candle types:
| Long Wick Candle | Short Wick Candle | |
|---|---|---|
| Wick length | At least 2x bigger than the body | Very short or absent |
| Price Behaviour | Rejection of price beyond a level | Strong directional movement |
| Common Signals | Reversal, rejection, fakeout | Continuation, strength, momentum |
| Best Use Cases | At support/resistance zones for reversals | In trends for breakout or momentum confirmation |
| Examples | Hammer, shooting star, pin bar | Marubozu |
Learn Pattern Trading With The WR Trading Mentoring
Mastering patterns like long wick candles becomes far more effective with WR Trading Mentoring.
Our mentorship teaches you how to focus on clear, opportunity-rich markets, develop a structured plan in 30 minutes, and interpret price action and indicators with precision. You’ll learn to minimize losses, know when not to trade, and make faster yet smarter decisions with the right mindset.
With personal coaching, WR helps you develop essential qualities for long-term trading success, including patience, resilience, and emotional sharpness.
(Learn To Trade And Read Candlestick Patterns Like A Pro)
Final Thoughts: Trading Long Wick Candles with Confidence
We have repeatedly seen long wick candlestick patterns as powerful technical analysis tools for identifying reversals and continuation zones. Whether you are looking at a hammer, shooting star, or pin bar, all long wick candles represent real-time trader psychology, often revealing hidden supply and demand dynamics.
Even so, their true edge lies in context, confirmation, and confluence. When used with trend direction, key levels, technical indicators along with precise entry and exit techniques, their success rate improves and they offer confident trades.