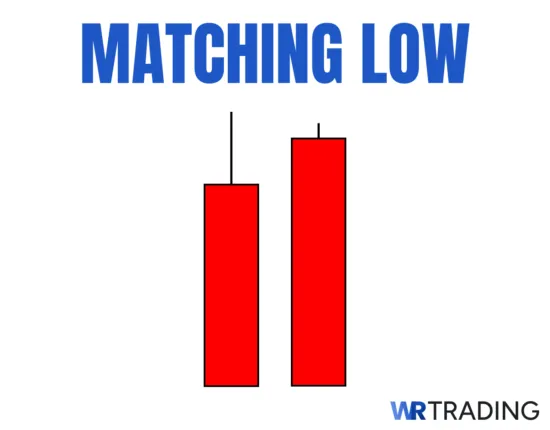
The Matching Low candlestick pattern is a two-candle bullish reversal formation that appears at the bottom of downtrends. This pattern consists of two consecutive candlesticks with identical or nearly identical low prices, signaling potential buying pressure and trend reversal. It indicates that sellers have exhausted their momentum at a specific price level and buyers are beginning to step in and defend that support zone.
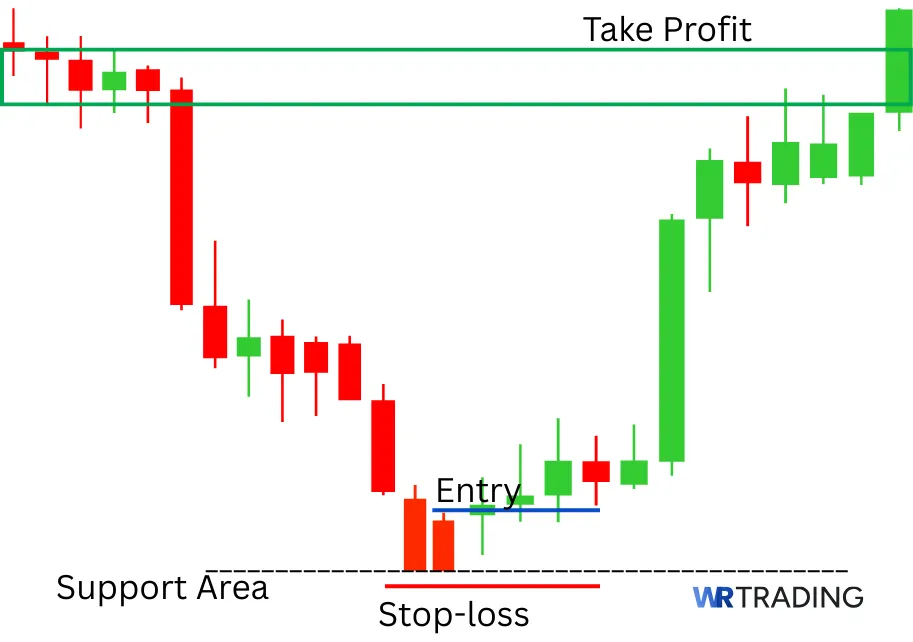
To capitalize on the potential reversal, traders can confirm buying strength by waiting for the second candlestick to close near its high. Then, open a long position above the second candlestick’s high, with a stop loss below the pattern’s low, effectively balancing potential gains with risk management.
This guide will show you exactly how to identify, analyze, and trade the Matching Low candlestick pattern for consistent profits. We’ll cover its formation psychology, trading strategies, success rates, and practical implementation across different market conditions.
Key Facts of The Matching Low Candlestick Pattern:
- Construction:
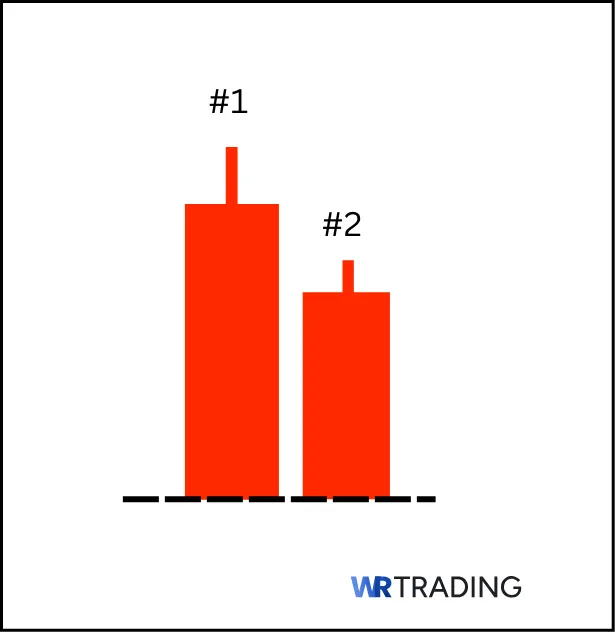
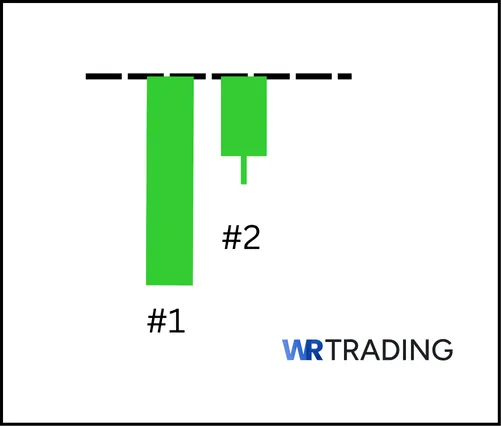
- First Candle: Typically bearish, continuing the existing downtrend
- Second Candle: Can be bearish or bullish, but must match the low of the first candle
- Type of Pattern: Bullish reversal
- Trend Prior Pattern: Established downtrend or bearish momentum required
- Opposite Pattern: Matching High (bearish reversal pattern)
- Entry Options: Entry after the confirmation candle; after the second candle tests the exact same low level as the first candle.
- Stop Loss Placement: Below the matching lows of both candles
- Interpretation: The Matching Low means that buyers are gaining momentum over sellers. The second candle in the pattern indicates that sellers have exhausted their momentum at a specific price level and buyers are beginning to step in and defend that support zone.
(Learn To Trade And Read Candlestick Patterns Like A Pro)
How Is The Matching Low Pattern Formed?
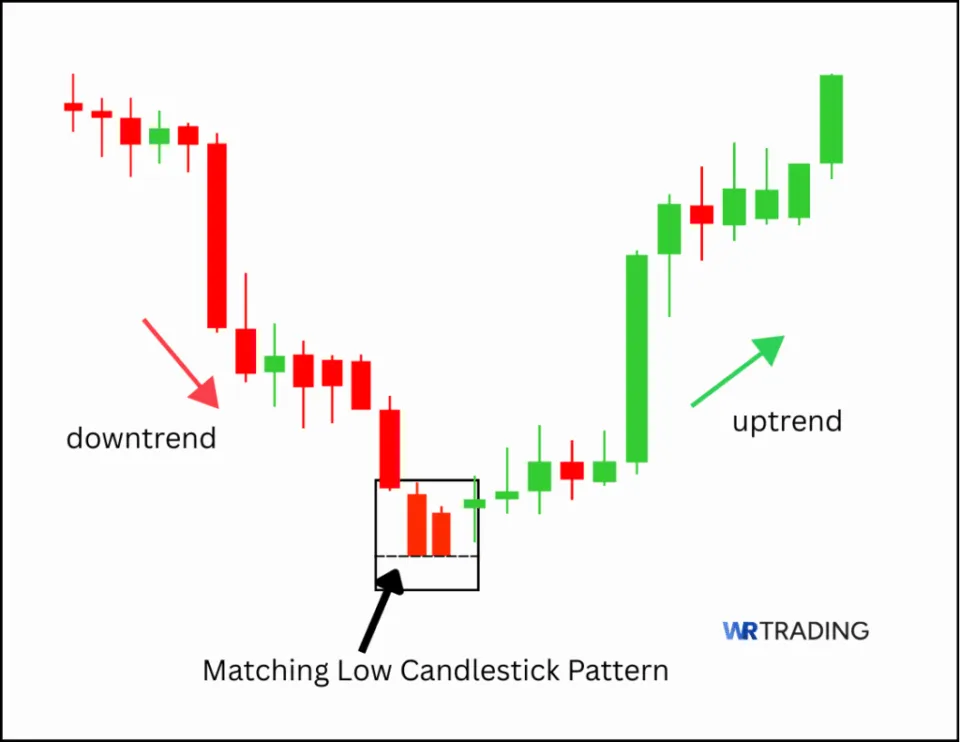
The Matching Low pattern develops during established downtrends when selling pressure begins to diminish at a specific price level. The formation requires exactly two consecutive candlesticks that share identical or nearly identical low prices, creating a clear support zone where buyers begin to emerge. Here are some specific characteristics:
- Prerequisite: This is an established downtrend with declining price momentum, which must be present before pattern formation. It typically consists of 3-5 consecutive bearish candles or a clear series of lower highs and lower lows.
- First Candle: The candle is usually bearish and continues the existing downward movement, often reaching what appears to be a new support level or significant low point in the current trend.
- Second Candle: A smaller green candle tests the same low level as the first candle but critically fails to break below it, demonstrating that selling pressure has been exhausted at this specific price point.
Matching lows typically fall within 0.1% to 0.5% of each other, depending on asset volatility, with forex pairs requiring a tighter tolerance than stocks or commodities.
The pattern completes in exactly two consecutive trading periods regardless of chart timeframe, with higher timeframes (daily/weekly) providing more reliable signals than shorter periods. It often shows a declining volume in Downtrend formation with potential volume expansion on the second candle, indicating increased buying interest at the matching low level.
What Does The Matching Low Candlestick Pattern Mean?
The Matching Low pattern represents a critical shift in market psychology from bearish dominance to potential bullish control. When prices reach the matching low level for the second time without breaking lower, this shows that sellers have exhausted their ability to push prices down further at that specific level.
From a buyer’s perspective, the matching lows indicate a potential value opportunity where institutional and retail buyers begin accumulating positions. The repeated test of the same low price suggests that this level has become an accurate support zone where buying interest consistently emerges.
Sellers, on the other hand, show signs of exhaustion when they cannot push prices below the established low despite having two opportunities to do so. This failure to break lower often triggers profit-taking among short sellers and reduces selling pressure.
Where Does The Name Of The Pattern Matching Low Come From?
The name “Matching Low” comes from the pattern’s fundamental visual characteristic, where two consecutive candlesticks create identical or nearly identical low prices, essentially “matching” each other at the same support level on the price chart.
(Learn To Trade And Read Candlestick Patterns Like A Pro)
What Is An Example Of The Matching Low Pattern?
Below is a clear example of the Matching Low pattern occurring in EUR/USD during a bearish trend in early trading sessions:
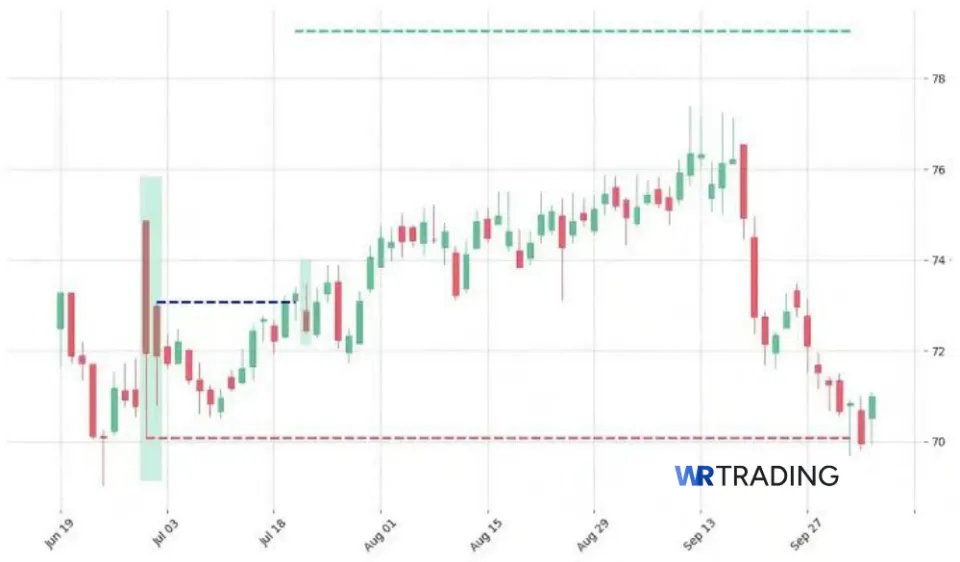
- First Candle: The opening price was at 1.0850, ending the day at 1.0820 and dropping further to 1.0815, which appeared to establish a new support point during the bearish rally.
- Second Candle: At the start of the candle at 1.0825, it dropped all the way to 1.0815 again like the previous candle, but buyers pushed the price back up, closing the candle at 1.0835 and ensuring the support remained.
Both candles reached the identical 1.0815 support level, but the second candle’s failure to break lower, combined with its higher close, signaled potential bullish reversal. EUR/USD rallied approximately 80 pips over the next several hours, confirming the pattern’s reversal signal and providing profitable opportunities for traders who recognized the formation.
How To Identify The Matching Low Pattern?
Identifying the Matching Low pattern requires systematic chart analysis focusing on specific market conditions and price formations during established downtrends. The key lies in recognizing when two consecutive candles create identical low points while demonstrating signs that selling pressure is weakening and potential buying interest is emerging at critical support levels. Here is our detailed process explained:
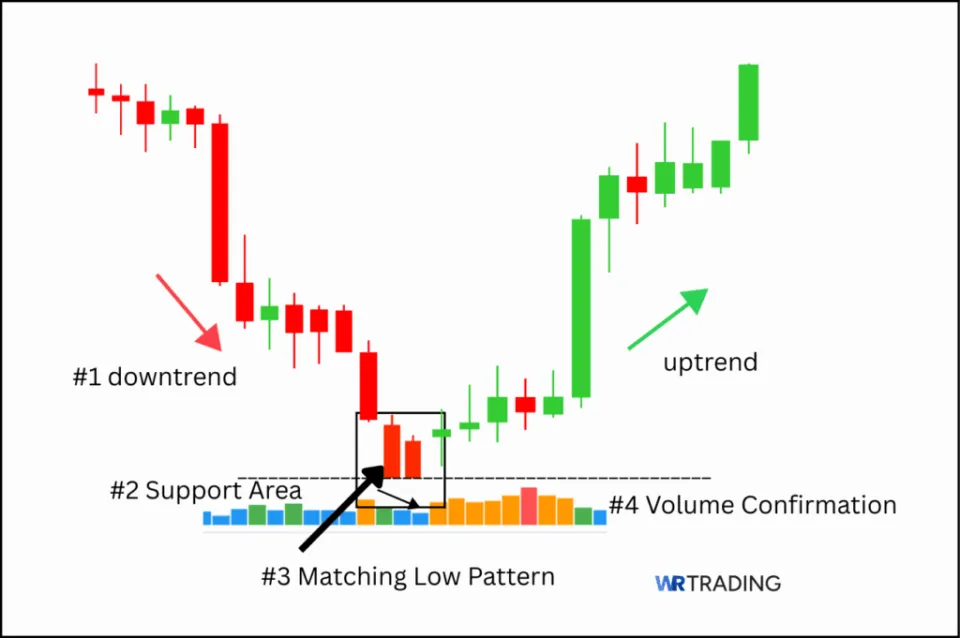
Step 1: Confirm Downtrend Context
Look for a clear trend in which prices are going down consistently and repeatedly in recent periods. Because the pattern fails during sideways or gaining markets, it’s necessary to confirm the downtrend before looking at signals of a possible upturn.
Step 2: Locate Support Areas
Focus on areas near significant support zones such as previous swing lows, major psychological levels (round numbers), Fibonacci retracement levels (61.8% or 78.6%), or horizontal support lines where price has previously found buying interest. These confluence areas dramatically increase the pattern’s reliability and success probability.
Step 3: Identify Matching Lows
Search for two consecutive candlesticks sharing nearly identical low prices within acceptable tolerance levels (typically 0.1% to 0.5%, depending on asset volatility). The first candle usually continues the bearish trend while the second candle tests the same low but demonstrates inability to break lower, often showing longer lower shadows or higher closing prices.
Step 4: Verify Volume Confirmation
Monitor trading volume during pattern formation, look for declining volume during downtrend, followed by potential volume expansion on the second candle. Higher volume on the second candle, especially if it closes higher than it opened, suggests that there is a genuine buying interest emerging at the matching low level.
Step 5: Consider Timeframe Restrictions
We have found out that higher timeframes (daily, weekly) provide more reliable signals due to reduced market noise and stronger institutional participation, while shorter timeframes (5-minute, 15-minute) may signify more false signals but offer more frequent trading opportunities for active traders.
(Learn To Trade And Read Candlestick Patterns Like A Pro)
How To Trade The Matching Low Pattern?
Trading the Matching Low pattern requires a systematic approach combining pattern recognition with proper risk management. The strategy focuses on entering long positions when the pattern signals potential trend reversal while maintaining strict controls against false signals. Below is a step-by-step on how to trade the matching low pattern:
- Find the right setup for the matching low
- Wait for the appearance of the matching low candlestick pattern
- Open your trade – entry point
- Wait for a confirmation or not
- Choose your trading take profit
1. Find The Right Setup For The Matching Low
The pattern only works when it forms after a downtrend. Look for price dropping into a major support zone, such as a prior demand level, a 0.618 Fibonacci retracement, or the base of a consolidation range. A valid setup occurs when bearish momentum starts fading. This can show up as weaker red candles, divergence on RSI, or slowing volume.
We never trade this pattern mid-trend. It’s designed for reversals, not continuation plays. It gains more weight when it forms at the end of a three-wave or five-wave drop, or near round-number zones (e.g., 1.0900 in EUR/USD). These are the zones where large buyers often step in.
2. Wait For The Appearance of The Matching Low Candlestick Pattern
Once price reaches the zone, wait for the full pattern to form. The sequence must be clear:
- First candle continues the downtrend, reaching a significant low point
- Second candle tests the exact same low level but fails to break below it
- Both candles must have matching lows within acceptable tolerance levels
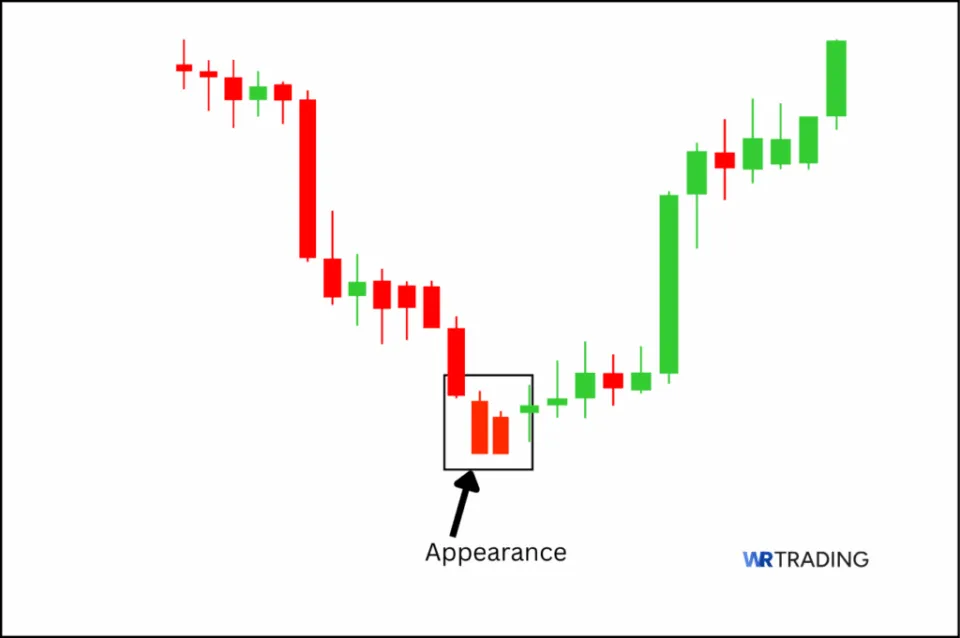
You don’t have to enter early. Let the pattern complete fully on a closed candle, especially on 4H or Daily charts. Entries taken mid-candle often lack confirmation and increase exposure to fakeouts. We always wait for confirmation, not guesses.
3. Open Your Trade – Entry Point
The entry comes immediately after the pattern completes. We place a buy stop order a few pips above the highest high of either candle within the pattern. This ensures you’re only triggered if the price continues upward. We recommend avoiding market orders, as they increase slippage and reduce precision.
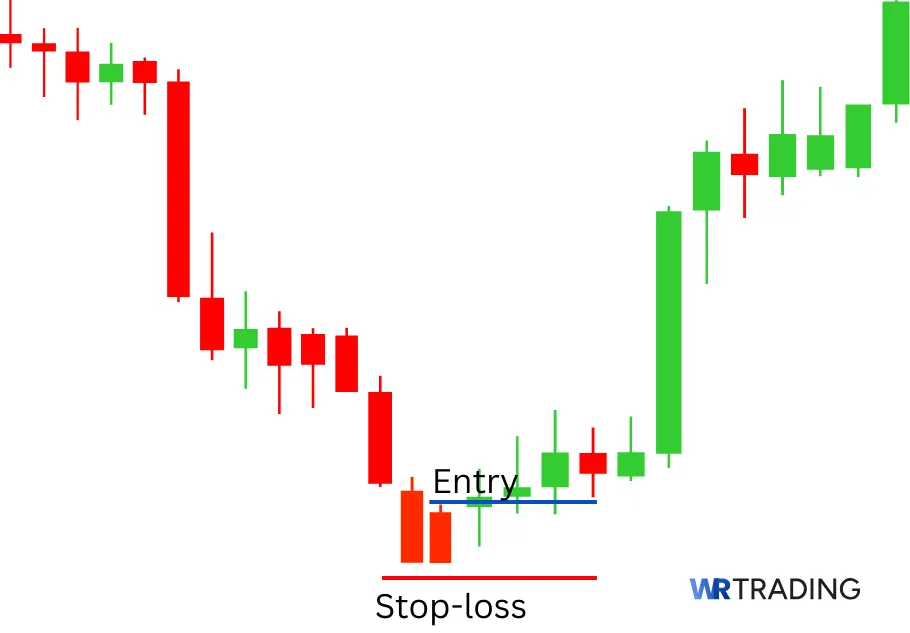
Your position size should be based on your account size and stop-loss distance. Risk should be a fixed 1% to 2% of total capital per trade. We use a calculator to determine the lot size based on the actual risk distance from entry to stop below the matching lows.
4. Wait For A Confirmation Or Not
Seek additional confirmation through volume analysis (higher volume on the second candle), momentum indicators showing divergence, or support from nearby technical levels. Although it might not be always necessary, we have noticed that confirmation signals significantly improve the pattern’s reliability and success rate.
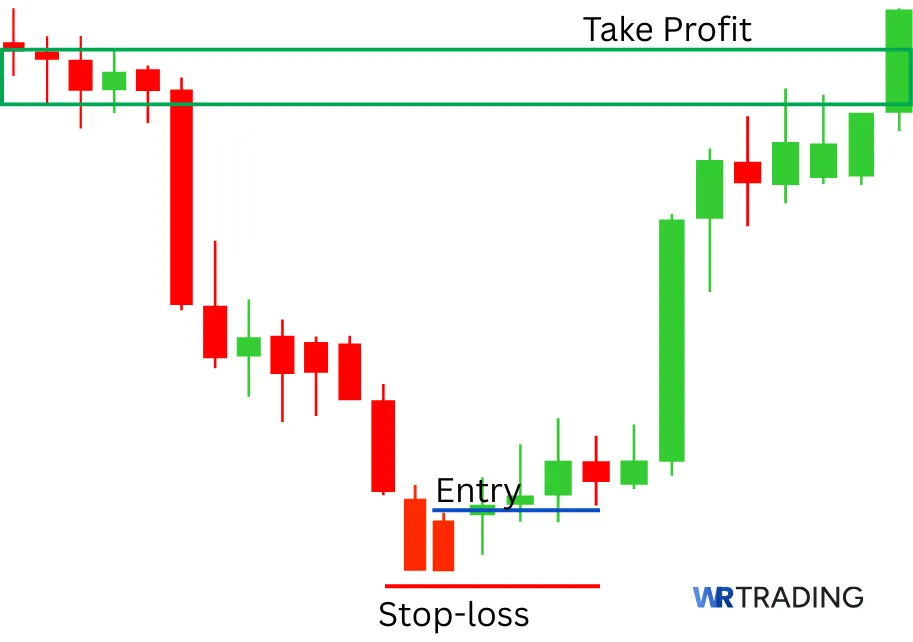
5. Choose Your Trading Take Profit
Set initial profit targets at previous resistance levels, Fibonacci retracement levels, or measure the height of the recent downward movement and project it upward from the pattern’s completion. Consider scaling out profits at multiple levels to maximize returns while protecting gains.
(Learn To Trade And Read Candlestick Patterns Like A Pro)
Which Strategies Can Be Used For The Matching Low Candlestick Pattern?
Here are some strategies we use to maintain a profitable Matching Low candlestick pattern:
- Volume-Based Strategy: This incorporates trading volume analysis to confirm the pattern’s validity and increase success probability. Traders look for higher volume on the second candle compared to the first, indicating increased buying interest at the matching low level. We have found out that declining volume during the downtrend, followed by expansion during pattern formation, suggests genuine accumulation and strengthens the reversal signal.
- Breakout Strategy: This approach focuses on entering positions when price breaks above the highest point of either candle within the pattern formation. To use this approach, you need to wait for momentum confirmation before committing capital, reducing false signal risk while sacrificing some profit potential. Set buy stops above the pattern’s high and enter when price demonstrates upward momentum.
- Indicator-Based Strategy: This combines the Matching Low pattern with momentum oscillators like RSI, MACD, or Stochastic indicators to identify potential divergences and oversold conditions. When the pattern forms alongside bullish divergence signals or extreme oversold readings, we have found that the probability of a successful reversal increases significantly.
- Support and Resistance Strategy: This approach emphasizes patterns forming at significant technical levels, such as previous swing lows, Fibonacci retracement levels, or major psychological price points. This confluence approach leverages multiple technical factors to identify high-probability setups where institutional buying interest is likely to emerge.
- News-Based Strategy: Finally, this strategy considers fundamental factors and economic events that might influence the asset’s direction when the pattern appears. We avoid the pattern during major news releases but may use it to enter positions when fundamental analysis supports the technical reversal signal.
What Is The Success Rate Of The Matching Low Candlestick Pattern?
According to candlestick expert Thomas N. Bulkowski, Matching Low candlestick patterns provides win rates up to 68-82% when traded correctly, making them particularly useful for day traders seeking a reliable directional signal pattern.
This places it among the most reliable bullish reversal patterns, especially when confirmed with volume or momentum tools. We found that the Matching Low performs best when it forms:
- After a clear downtrend
- Near a strong support level
- With confirmation, such as a breakout or volume surge
In our trading plan, we boost this pattern’s success rate by combining it with RSI and MAC divergence, trendline breaks, and price reacting off key demand zones. When applied with discipline, this pattern becomes a high-confidence entry with a measurable edge.
Is the Matching Low Candlestick Pattern Suitable For Beginners?
Yes, the Matching Low candlestick pattern is suitable for beginners due to its straightforward identification process and clear visual characteristics. The pattern’s simple two-candle structure makes it easier to recognize compared to more complex multi-candle formations, while its logical interpretation provides new traders with a hit rate of market psychology and reversal signals.
(Learn To Trade And Read Candlestick Patterns Like A Pro)
What Are The Pros And Cons Of the Matching Low Pattern?
The Matching Low is a pattern with clear, structured and solid reversal logic, but like every tool in trading, it comes with both advantages and limitations. Below are the key pros and cons at a glance:
Pros
- Offers easy visual identification and recognition
- Provides clear entry and exit signal definition
- Works across multiple timeframes and assets
Cons
- Might require confirmation signals for moderate success rate
- Can produce false signals in sideways markets
- Can be misread or forced in invalid trend conditions
What Are The Advantages Of The Matching Low Pattern?
The following advantages make the pattern a favorite among profitable traders who have mastered the setup.
Visually Clear and Easy to Identify
The pattern has an unmistakable chart signature that traders can quickly recognize. The two-candle structure eliminates confusion often associated with more complex patterns, allowing traders to make swift decisions without extensive analysis.
Clear Entry and Exit Signal Definition
Its clear entry and exit signal definition provides traders with precise parameters for trade execution and risk management. The pattern offers natural stop loss placement below the matching lows, creating a logical risk boundary that aligns with the pattern’s underlying psychology.
Works Across Multiple Timeframes and Assets
One of the biggest strengths of this pattern is the versatility across multiple timeframes and assets. Whether trading forex, stocks, commodities, or cryptocurrencies, the Matching Low pattern maintains its relevance and effectiveness across different market environments.
What Are The Disadvantages Of The Matching Low Pattern?
For some traders, these cons are also positives. For others, not so much. Regardless, it is important to know the drawbacks of the pattern:
Requires Confirmation For Moderate Success
Traders require confirmation signals for a moderate success rate, and this represents a significant limitation that traders must acknowledge when incorporating this pattern into their strategies. Without additional confirmation from volume, momentum indicators, or support level confluence, there is a drop in the pattern’s reliability, leading to increased false signals and potential losses.
Can Produce False Signals in Sideways Markets
During periods of low volatility or range-bound trading, there might be times of false signal production without meaningful trend reversals, leading to multiple small losses. This can frustrate traders and erode account equity.
Can be Misread or Forced in Invalid Trend Conditions
Traders often force the pattern where it doesn’t belong. For example, spotting it in uptrend conditions or after just one red candle isn’t valid. We teach traders to focus on clean downtrends only, with structure and zone alignment.
Can The Matching Low Have Failure Signals?
Yes, the Matching Low candlestick pattern can fail with a probability of approximately 25-40%, depending on market conditions and confirmation factors. Pattern failure typically occurs when price breaks decisively below the matching lows, invalidating the support level and continuing the original downtrend with renewed momentum.
Failure signals become evident when the next candle opens with a significant gap down or immediately breaks below the established matching low level, often triggering stop losses and creating additional downward pressure through forced liquidation.
Which Indicators Can Be Combined With The Matching Low to Increase Its Success?
Several technical indicators can significantly enhance the Matching Low pattern’s effectiveness when used as confirmation tools. Here are some of them:
| Indicator | Setting | Description |
|---|---|---|
| Relative Strength Index | 14-period | We use RSIs to effectively identify oversold conditions when the pattern forms. We teach our traders to look for RSI readings below 30 during pattern formation, particularly when bullish divergence appears between price action and RSI. This combination suggests genuine reversal potential from oversold levels. |
| Moving Average Convergence Divergence | 12, 26, 9 | We advise traders to look out for the MACD histogram turning positive or the MACD line crossing above the signal line. Bullish divergence between the MACD and price strengthens the reversal probability significantly |
| Volume Indicators | Visible Range or Session Volume tools | Volume indicators such as On-Balance Volume (OBV) confirm institutional participation during formation. Increasing volume on the second candle or bullish volume divergence suggests genuine accumulation at the matching low level, supporting the reversal thesis. |
| Stochastic Oscillator | 14, 3, 3 | We use this to identify oversold conditions and reversal momentum. Endeavour to look out for for %K line crossing above the %D line from oversold territory (below 20) when the pattern completes, providing optimal entry timing with momentum confirmation. |
We don’t use all these indicators at once. Our rule is simple: two solid confirmations max. The goal is to use the pattern as a structural clue, then validate it with one or two clean tools that fit the current market context.
(Learn To Trade And Read Candlestick Patterns Like A Pro)
What Are Similar Patterns To The Matching Low Pattern?
Here are some similar patterns and alternatives to the matching low pattern:
| Pattern Name | Type | Description |
|---|---|---|
| Bullish Hammer | 1-candle reversal | A single candle with a small body and long lower wick at the bottom of a downtrend, signaling rejection of lower prices |
| Bullish Doji | 1-candle reversal | This is another single candle with open and close at nearly identical levels, which indicates indecision. |
| Morning Star | 3-candle reversal | A red first candle, a small-bodied middle candle (can be green or red), followed by a strong green candle that closes above the midpoint of the first. |
| Piercing Pattern | 2-candle reversal | This is a two-candle bullish reversal where the second candle opens below and closes above the midpoint of the first |
| Bullish Engulfing | 2-candle reversal | A small red candle followed by a large green candle that completely engulfs it. It’s a strong signal of bullish reversal |
| Dragonfly Doji | 1-candle reversal | This is a single candle with a long lower shadow, no upper shadow, indicating buying pressure |
| Inverted Hammer | 1-candle reversal | This is a single candle with a long upper shadow appearing after a downtrend. |
These patterns, like the Matching Low, work best in bearish trends and near support zones. They are not interchangeable, but learning to spot them in context gives you more setups in your technical playbook. Find more alternatives in our free Candlestick Patterns PDF.
What Is The Opposite Pattern Of The Matching Low?
The Matching High candlestick pattern serves as the direct opposite of the Matching Low formation. It appears as a bearish reversal signal at the top of uptrends and consists of consecutive candlesticks sharing identical or nearly identical high prices, indicating that buying momentum has been exhausted at a specific resistance level.
What Is The Difference Between The Matching Low And The Matching High Candle Pattern?
The fundamental difference between Matching Low and Matching High patterns lies in their market positioning and directional bias, with each serving opposite roles in trend analysis and trading applications. However, other differences are highlighted in the table below:
| Aspect | Matching Low | Matching High |
|---|---|---|
| Market Position | Bottom of downtrends | Top of uptrends |
| Signal Direction | Bullish reversal | Bearish reversal |
| Matching Price | Identical low prices | Identical high prices |
| Psychology | Selling exhaustion | Buying exhaustion |
| Entry Strategy | Long positions | Short positions |
| Stop Loss | Below matching lows | Above matching highs |
| Target Direction | Upward movement | Downward movement |
What Is The Difference Between The Matching Low And Bearish Stick Sandwich Candle Pattern?
The Matching Low and Bearish Stick Sandwich patterns differ significantly in structure, formation requirements, and market interpretation despite both involving multiple candle analysis.
The Matching Low focuses on identical low prices between two consecutive candles as a bullish reversal signal, while the Bearish Stick Sandwich requires three specific candles with particular color and positioning requirements for bearish continuation signals.
What Are The Limitations Of The Matching Low Pattern?
Some of the limitations of the pattern include:
- Weak in sideways or low-volume markets
- Less reliable on very short time frames
- Depends heavily on volume confirmation, which may not always be available
- There’s a likelihood of false signal generation
Learn Pattern Trading With WR Trading Mentoring
At WR Trading, we go beyond pattern recognition. Our mentoring program trains traders to execute setups like the Matching Low pattern with risk control, confirmation, and multi-timeframe technical analysis.
Our mentoring program covers advanced pattern trading strategies, risk management techniques, and practical application of technical analysis in real market scenarios. Join traders worldwide who have enhanced their technical analysis skills through our proven methodology and achieve consistent trading success with professional guidance.
(Learn To Trade And Read Candlestick Patterns Like A Pro)
Conclusion: Master the Matching Low Pattern for Consistent Trading Success
The Matching Low candlestick pattern offers traders a reliable framework for identifying potential trend reversals at critical support levels. To trade this pattern effectively, identify the second candlestick close near its high, confirm buying strength, and then enter a long position above the high of the second candlestick with a stop loss below the pattern’s low.
The pattern provides a more reliable signal at higher timeframes (daily, weekly) due to reduced market noise and stronger institutional participation.
To unlock consistent trading success, we recommend using this pattern as part of a comprehensive trading strategy rather than a standalone signal, and watch your proceeds grow across all markets.