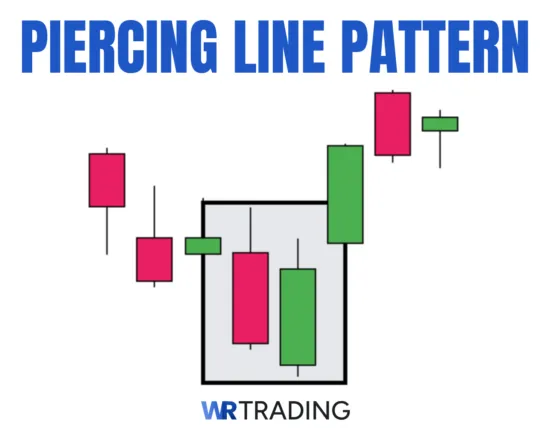
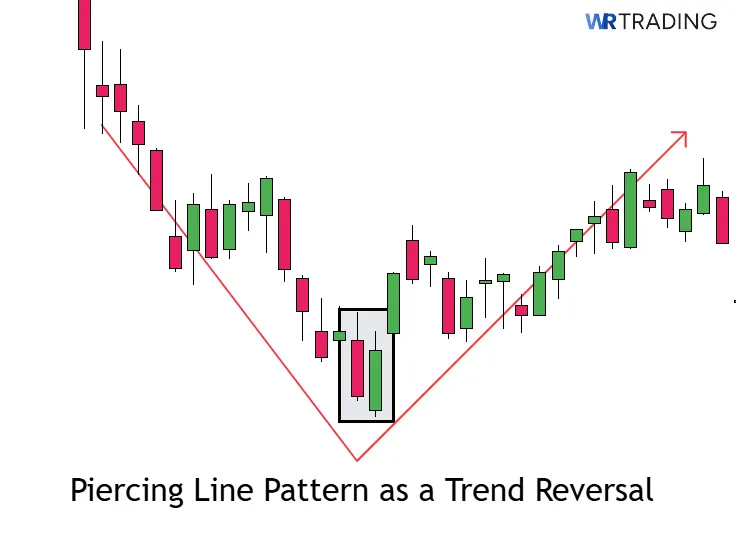
The Piercing Line is a two-candle bullish reversal pattern that forms at the end of a downtrend. It begins with a large red candle followed by a green candle that opens with a gap down and closes above the midpoint of the first candle’s body. This closing action signals a shift from bearish momentum to potential buying strength.
Traders see this pattern as a buy signal that sellers have pushed the price lower, but buyers have stepped in aggressively and are attempting to reverse the trend. The stronger the second candle closes into the first candle’s body, the more convincing the potential reversal becomes. The Piercing Line is often found at key support levels, near oversold conditions, or at the end of a corrective leg within broader bullish structures.
This guide will cover everything you need to know about the Piercing Line candlestick pattern such as how to identify it, how it forms, what it means, how to trade it.
Key Facts of the Piercing Line Candlestick
- Type of Pattern: Two-candle bullish reversal pattern.
- Construction:
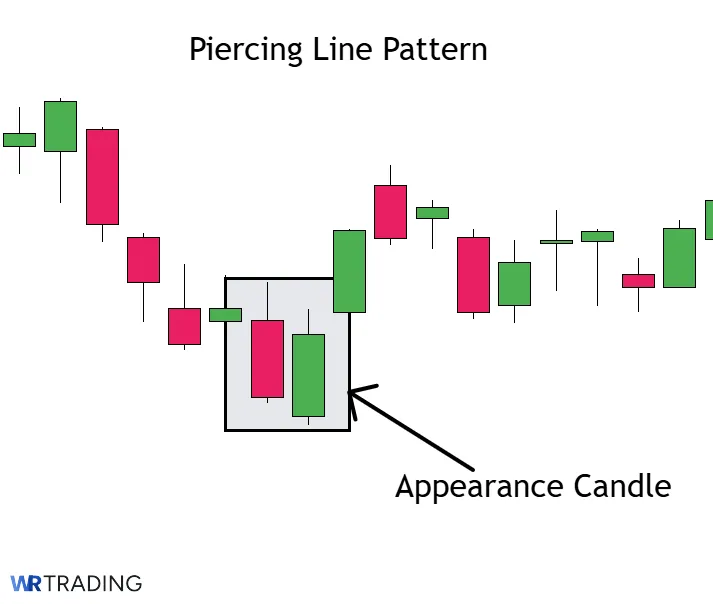
- First Candle: A large red candle that forms during a downtrend, closing near its low and showing strong bearish pressure.
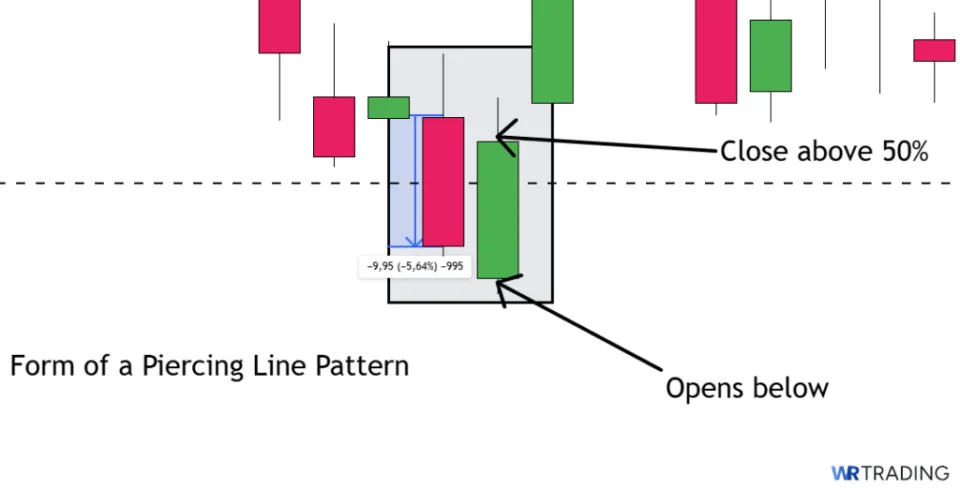
- Second Candle: A green candle that opens with a clear gap down below the first candle’s close. It then rallies upward and closes above the midpoint of the first candle’s body, showing a shift in control from sellers to buyers.
- Forecast: Signals a potential bullish reversal, where buyers interrupt the previous selling momentum and create a strong bounce from a support zone.
- Trend Prior to Pattern: Appears after a downward trend, corrective leg, or prolonged selling phase.
- Opposite Pattern: Dark Cloud Cover.
- Stop-Loss Placement: Placed just below the low of the second candle to protect against failed reversals.
- Candlestick Success Rate: Roughly 64%.
(Learn To Trade And Read Candlestick Patterns Like A Pro)
What Is A Bullish Piercing Line Candlestick Pattern?
A bullish Piercing Line is a bullish reversal signal that forms during a downtrend and marks a turning point where buyers step back into the market with strength. The first candle continues the decline with a solid red close near the low, showing that sellers are still in control. The next candle opens below the previous low, adding pressure, but quickly reverses as buyers take over and drive the price upward. By the close, the green candle finishes above the midpoint of the red body, showing a possible reversal.
This pattern shows a change in sentiment and an early attempt to shift momentum in favor of the bulls. It often traps late sellers who chased the gap down and forces them to cover as buying accelerates. The stronger the second candle pushes into the previous range, the more convincing the signal becomes.
When the structure appears near technical support, rising volume, or with additional confirmation from indicators, it can offer a high-quality setup for a short-term bounce or the beginning of a trend reversal.
What Is A Bearish Piercing Line Candlestick Pattern?
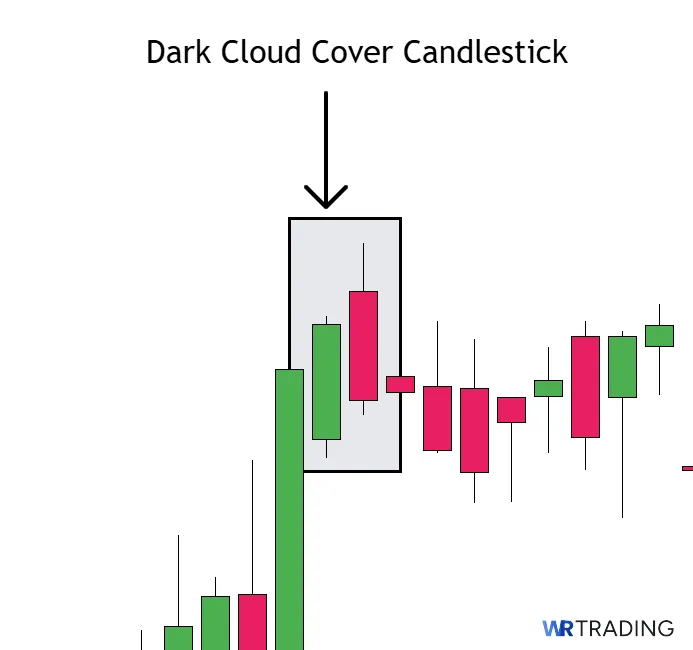
There is no bearish version of the Piercing Line. When a similar structure forms after an uptrend, it is known as the Dark Cloud Cover pattern. It uses the same two candle layout but flips the direction.
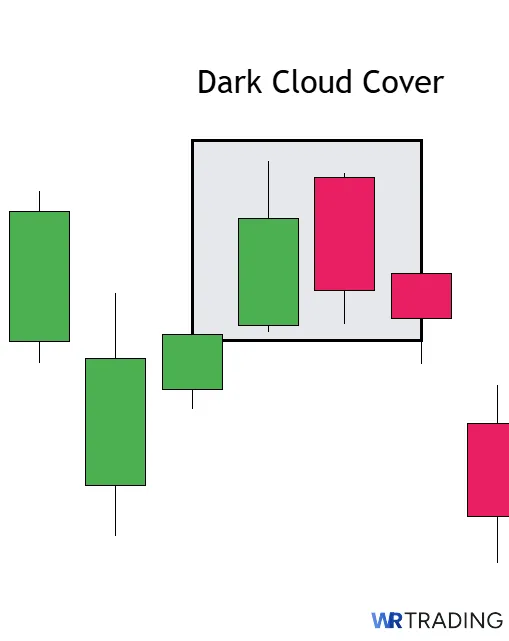
It starts with a large green candle that follows through on the previous buying. The next session opens above that high, but instead of continuing upward, the market drops sharply. Sellers take over and close the red candle well into the body of the previous green bar, usually beyond the halfway mark.
What looks like another strong push from buyers suddenly breaks down and gives way to aggressive selling. The failed gap and deep close into the prior range send a clear message that upside momentum is stalling. It often marks the beginning of a shift in direction, making it a great reversal pattern to utilize.
How Does a Piercing Line Candlestick Pattern Form?
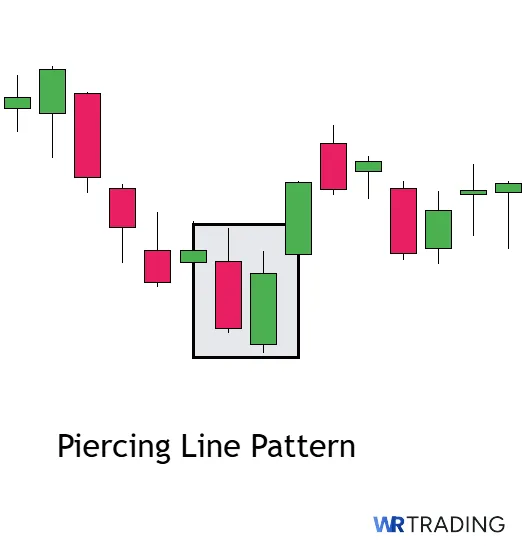
The Piercing Line pattern forms after a clear downtrend followed by consecutive lower highs and lower lows or a significant downward corrective move. The initial bearish candle continues the prevailing downward momentum, reinforcing sellers’ dominance. The second candle starts with a gap below the first candle’s close, often perceived as a bearish continuation.
However, this lower opening quickly becomes the low point of the session. Buyers step in aggressively, driving prices higher throughout the day, closing substantially into the bearish candle’s range.
This powerful bullish recovery signals that selling momentum has stalled and a potential reversal could be imminent. The entire formation takes place over two consecutive sessions, most commonly observed on daily or weekly charts but also valid on shorter intraday timeframes.
(Learn To Trade And Read Candlestick Patterns Like A Pro)
What Does the Piercing Line Candlestick Pattern Mean?
The Piercing Line pattern signals that the balance between buyers and sellers has shifted. It tells you that after a period of strong selling, buyers have stepped back in with enough force to recover a significant portion of the previous loss.
The green candle not only reverses the direction intraday but also finishes above the midpoint of the red body, which shows that demand has regained strength. This shift often marks the early stage of a rebound or even the beginning of a new trend, depending on the broader context.
Psychologically, the pattern shows a sudden change in sentiment. Sellers enter the session confident, pushing the market lower again on the open, but they quickly lose momentum as buyers take advantage of the discount. Once the price climbs back into the prior range, confidence returns to the long side.
The Piercing Line often catches late bears off guard, forcing them to cover, and draws in new buyers who recognize that the previous pressure has failed. That combination can create a burst of upward momentum in the bars that follow.
Example of the Piercing Line Pattern in the Chart
On this EUR/USD 4-hour chart, the price had been trending lower and printed a sharp red candle that opened near 1.0210 and closed around 1.0182. That drop extended the existing down move and broke beneath recent support. The next green candle opened slightly lower, just under 1.0180, but quickly reversed course as buying pressure stepped in. By the close, price had rallied to about 1.0206, easily closing above the midpoint of the previous candle and confirming the Piercing Line pattern.
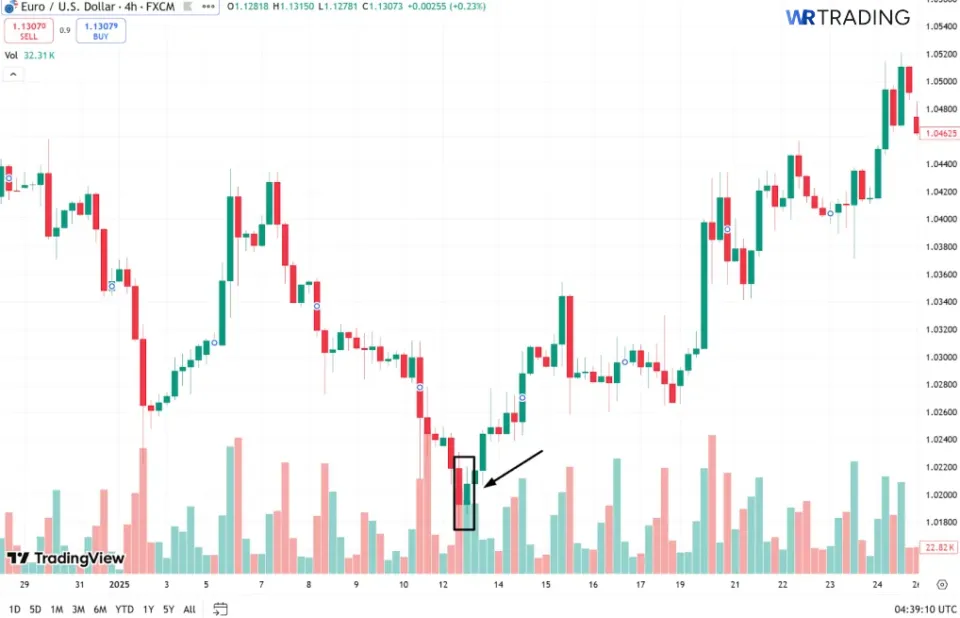
What followed was a shift in momentum as the pair climbed steadily in the next few sessions. The quick recovery from the intraday low, combined with strong volume and a decisive close above the midpoint, gave early signs that sellers had lost control. This example shows how the Piercing Line can provide a clear visual reversal when it appears after a strong decline and in the right location on the chart.
(Learn To Trade And Read Candlestick Patterns Like A Pro)
How to Identify a Piercing Line Candle in the Chart?
To spot a Piercing Line, start by scanning areas where price is in a clear decline. Look for a sharp red candle that closes near its low and stands out from recent bars in both size and direction. This candle should come after a series of lower highs and lower lows, or at least a noticeable drop that pushes the market into support or oversold conditions. The pattern gains strength when the pattern appears near previous demand zones, round number levels, or the lower edge of a volatility channel.
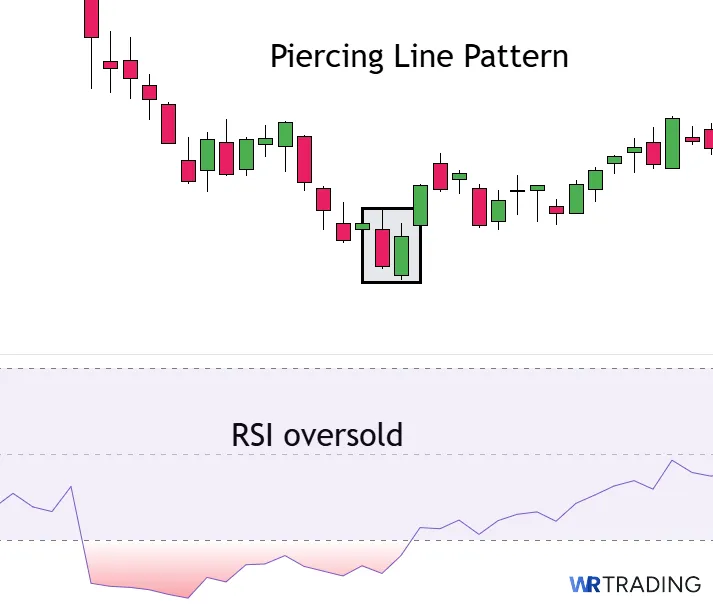
Once the red candle is in place, the next bar becomes important. The second candle must open below the previous low to create a gap, then rise steadily throughout the session. To confirm the pattern, the green candle must close above the midpoint of the red body. Without that midpoint close, it doesn’t qualify as a Piercing Line. You should also check for rising volume or supporting indicators like RSI climbing out of oversold territory. These extra details help confirm that the reversal is not just a temporary bounce but a possible change in control.
How to Trade the Piercing Line Candlestick Pattern
Trading the Piercing Line pattern requires a complete setup understanding where the pattern forms, how strong the candles are, and what tools confirm the signal. The goal is not just to recognize the pattern, but to build a plan around it with clear rules for entry, stop-loss, and exit.
The strategy below will walk you through a quick four-step method to trade the Piercing Line effectively. You will see how to
- Find the Right Piercing Line Candlestick Pattern Setup
- Wait for the Appearance of the Piercing Line Candle
- Open Your Trade – Entry Point
- Choose Your Trading Take Profit
Find the Right Piercing Line Candlestick Pattern Setup
Start by focusing on context, a Piercing Line is only valid when it forms after a clear move lower. That could be a series of red candles in a short-term downtrend or a longer-term corrective phase inside a broader uptrend. The most reliable setups appear near strong horizontal support levels, moving average clusters, or areas where price previously bounced. You want the market to be stretched, not just drifting lower, so the reversal carries more weight.
The best patterns usually form at extremes. Look for a wide red candle that breaks to new lows and finishes near its bottom. Then, look one candle ahead for a gap lower that quickly gets filled. If the second candle pushes into the prior body and closes above the halfway point, it’s a signal to take seriously.
You can also scan for RSI near or below 30, or signs of divergence, which help confirm that the selling has run its course. The cleaner the setup, the stronger the follow-through tends to be.
Wait for the Appearance of the Piercing Line Candle
Next, you should let the pattern finish before making any decisions, and you should never rush into a trade based on how a candle is forming. A Piercing Line is not valid unless the second candle closes above the midpoint of the red body. If that level is missed, the signal loses strength. During the session, the candle might look promising, but late selling can shift the close below the critical level. Waiting until the bar is complete avoids false positives and protects your capital.
Also, you want to look beyond just the price, as a solid Piercing Line often comes with increasing volume during the second candle. That signals strong buying interest and gives the reversal more credibility. Weak volume means fewer committed buyers, and that raises the risk of a failed bounce. You can also cross-check with other tools. If MACD starts to curl up, or if the green candle closes above a short-term moving average, it can be a sign that momentum is beginning to change.
Open Your Trade – Entry Point
There are two clean ways to enter. One approach is to go long at the close of the green candle, once the Piercing Line pattern is confirmed. This gives you immediate exposure to the potential bounce and ensures you do not miss a fast move. The other option is to wait for additional confirmation by setting a buy-stop just above the high of the green candle. If the price breaks that level in the next session, it shows that bulls are following through with momentum. Either choice works, depending on your risk preference and how much confirmation you want.
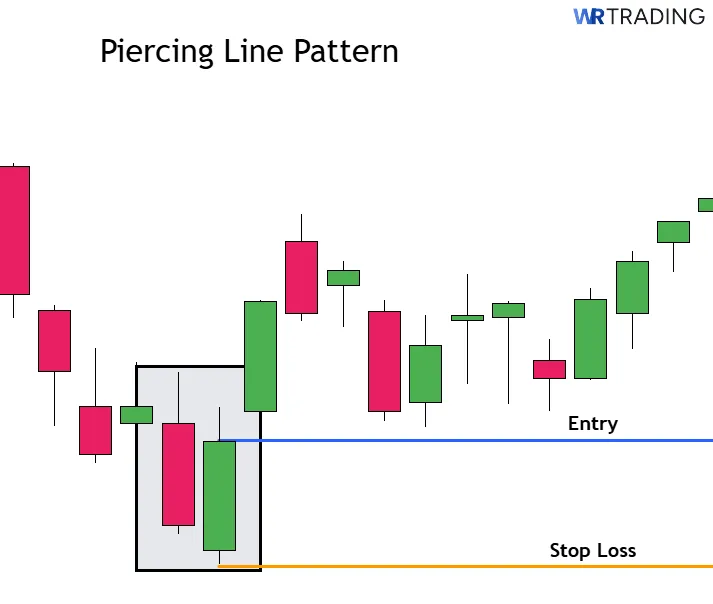
Where you place your stop matters just as much as the entry, since you need to protect your capital in case of a false signal. The most common location is just below the low of the green candle. If the market trades below that level after forming a Piercing Line, it means the pattern failed and the reversal was not real.
That stop placement also gives you a clean invalidation point with minimal risk. It is close enough to limit losses, but not so tight that normal fluctuations knock you out of the trade without cause.
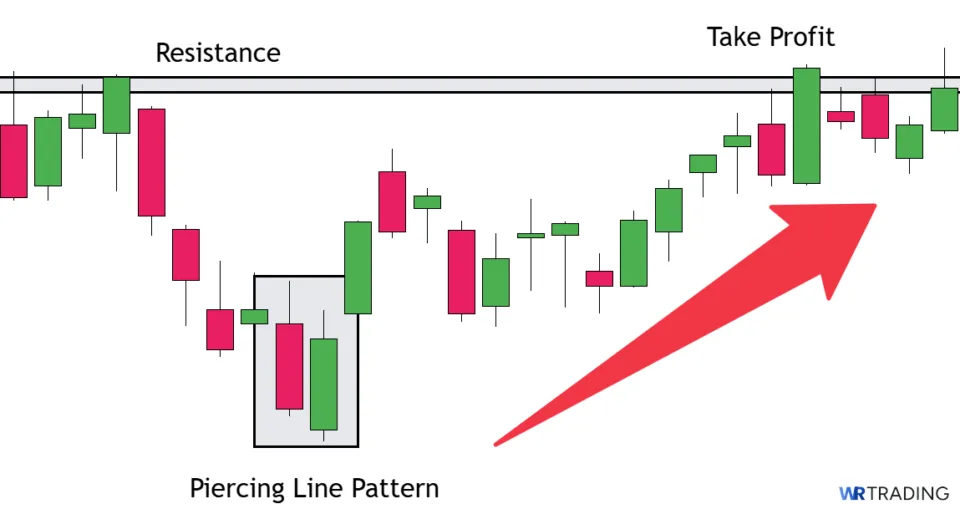
Choose Your Trading Take Profit
Targeting the right exit point reduces emotional trading and provides a structured approach. A good method is to use the length of the red candle and project that distance upward from the green close. That gives you a measured move target that reflects the strength of the reversal. Another approach is to look for nearby resistance levels, such as swing highs, round numbers, or a declining moving average. When the price reaches those areas, it often stalls, making them smart places to take profit.
Furthermore, you can let part of the trade run as many traders close half the position at the first target, then trail the stop on the rest. This captures immediate gains while keeping exposure in case the move turns into a larger trend.
A moving average, like the 20-period EMA, can act as a dynamic trailing stop. As long as the price stays above it and the trend remains intact. Once it breaks below, you exit and lock in the rest of the profit. That way, you balance reward with protection.
(Learn To Trade And Read Candlestick Patterns Like A Pro)
What Is The Success Rate Of The Piercing Line Candlestick Pattern?
Historical backtests show that the Piercing Line candlestick pattern has a success rate of 64%, according to Thomas Bulkowski’s performance ranking of candlestick patterns. The Piercing Line achieves an average success rate when the second candle appears with higher volume and the pattern forms near a support level.
Bulkowski’s data is based on thousands of stock samples and shows the pattern ranked favorably among common two-bar reversal formations. That said, results vary depending on the market, timeframe, and how the setup is filtered.
What Are the Pros and Cons of Trading the Piercing Line Candle Pattern?
Before using the Piercing Line in real trades, you should know the benefits and the limitations. The pattern can offer precise setups with clean risk but also breaks down easily if the structure is weak or the conditions are wrong. Here are the main pros and cons tof the Piercing Line:
Pros
- Clear Entry and Stop Placement
- Fast Setup With Only Two Candles
- Works Well Around Support Levels
- Easy to Spot Without Indicators
- Shows a Shift in Momentum Clearly
Cons
- Requires a clear gap that is not always visible
- Weak when there is no clear downtrend
- Less effective without volume or indicator confirmation
- Shallow green closes reduce quality
- Stops can be too close in volatile conditions
What Are The Advantages Of The Piercing Line Pattern?
The Piercing Line pattern is favored by many traders because of its signal meaning, speed of formation, and the structure it brings to reversal setups. Its simplicity makes it easy to understand, yet it still reflects an important psychological shift in the market. Here are some benefits of the pattern:
- Clear Entry and Stop Placement: The pattern gives you a natural entry point once the green candle closes above the midpoint of the red candle. It also defines risk clearly, as the low of the second candle is a logical place to put your stop.
- Fast Setup With Only Two Candles: The Piercing Line completes in just two sessions, unlike multi-bar patterns that take time to form. This makes it ideal for spotting quick reversals and acting before broader confirmation appears.
- Works Well Around Support Levels: The pattern gains strength when it forms near a strong support zone, such as a swing low, round number, or moving average. Prices reacting off those areas with this pattern often signals that demand is stepping in.
- Easy to Spot Without Indicators: You do not need any complicated tools or software to find this pattern. It is based purely on price action, making it easy to identify on any chart with candlesticks.
- Shows a Shift in Momentum Clearly: The second candle erasing more than half of the previous loss shows that buyers are willing to absorb selling pressure. That change often leads to short covering or fresh buying in the next few bars.
What Are The Disadvantages Of The Piercing Line Pattern?
The Piercing Line is not a perfect setup, and like any candlestick pattern, it can fail under the wrong conditions. Some of its weaknesses come from relying on a specific structure that does not always reflect what the broader market is doing. Knowing where it falls short helps avoid using it blindly and improves the way it fits into a complete strategy.
- Requires a clear gap that is not always visible: The Piercing Line depends on a gap between the close of the red candle and the open of the green one. On many forex or crypto charts with continuous trading or feed differences, this gap may be missing entirely. Without that separation, the structure loses one of its key requirements.
- Weak when there is no clear downtrend: This pattern is only effective after a defined move lower. If it forms during sideways price action or in a choppy market, it does not represent a real shift in sentiment. In those cases, it becomes just noise rather than a signal.
- Less effective without volume or indicator confirmation: A Piercing Line that forms on weak or flat volume often lacks conviction. The setup works best when there is rising demand that supports the price shift. Without that confirmation, the bounce may fail quickly.
- Shallow green closes reduce quality: If the second candle only closes a few points above the midpoint of the first, the pattern is weaker. These soft penetrations do not reflect strong buying pressure and often lead to limited follow-through. A deeper close into the red candle makes the reversal more reliable.
- Stops can be too close in volatile conditions: Although the stop below the green candle is logical, it can be vulnerable in fast-moving markets. Sharp pullbacks often hit stops before the trade has time to develop. This leads to early exits even when the larger move continues.
Can the Piercing Line Pattern Have Failure Signals?
Yes, the Piercing Line can fail even with a textbook structure if market context or confirmation is missing. Recognizing signs of weakness early allows traders to filter out low-quality setups and avoid entering trades that lack real momentum. Below are failure signals that you should be aware of:
- Weak close that barely clears the midpoint: A close that sits just above the midpoint of the red candle often reflects hesitation rather than strong buying. While the pattern technically qualifies, the shallow close leaves sellers with plenty of control. These setups rarely generate sustained moves and often reverse within the next one or two candles.
- Low or flat volume on the second candle: Volume should rise during the green candle to confirm buying interest. If volume stays low, it suggests that the bounce is weak and possibly driven by short-term covering or lack of participation. Without volume confirmation, the reversal signal loses credibility and may not hold.
- Resistance zone sitting directly above the second candle: If the green candle closes right below a clear resistance level, such as a moving average or previous swing high, the price may stall immediately. Sellers are often waiting at those areas to re-enter, which cuts off any further upside. The reversal fails not because of structure, but because of location.
- Long upper wick on the second candle: A green candle with a large upper shadow shows that buyers attempted to rally but were rejected before the close. This indicates strong selling pressure remains active in the market. These candles often lead to failed reversals or choppy follow-through.
- No confirmation from supporting indicators: When RSI remains weak, MACD does not shift, or momentum indicators show no change, the pattern stands alone without reinforcement. The price structure may look solid, but the lack of broader confirmation raises the risk of failure. High-probability reversals usually include multiple signals working together.
(Learn To Trade And Read Candlestick Patterns Like A Pro)
Which Indicators Can Be Combined With The Piercing Line Pattern?
The Piercing Line works best when confirmed by other tools that support the shift in momentum. Indicators help filter weak signals and add precision to the setup. Below are seven indicators that pair well with this pattern, including the specific settings most traders use and how each one adds value.
- Relative Strength Index (RSI): RSI is most effective with the Piercing Line when it is below 30 and starting to turn upward. A rising RSI from oversold conditions confirms that bearish momentum is fading and buyers are stepping in. Using the standard 14-period setting provides a clean view of momentum shifts without reacting to minor price swings.
- Moving Average Convergence Divergence (MACD): MACD becomes useful when the pattern forms as the MACD line crosses above the signal line or the histogram starts to print positive values. This shift signals a change in underlying momentum that supports the price structure. The 12, 26, 9 setting is the most widely used and gives reliable confirmation on swing and intraday charts.
- Volume: An increase in volume on the green candle gives immediate confirmation that buyers are active and absorbing supply. Standard volume bars with no smoothing or adjustments are enough to confirm whether demand is behind the reversal.
- 20-Period Exponential Moving Average (EMA): When the price closes back above the 20 EMA shortly after the Piercing Line forms, it often shows that short-term momentum is turning bullish. If the second candle itself closes above the EMA, the setup becomes much stronger. This moving average also acts as a dynamic guide for managing the trade after entry.
- Average True Range (ATR): ATR helps measure current volatility, which is useful for setting realistic stop-loss levels after the pattern forms. When ATR is elevated, giving the trade more room reduces the chance of getting stopped out by noise. A 14-period setting balances recent volatility without overreacting to short-term price spikes.
Alternatives to the Piercing Line Pattern:
| Pattern | Type | Best Use Case | Key Characteristic / Condition |
|---|---|---|---|
| Bullish Engulfing | Two-candle bullish reversal | Best used after a sharp selloff where the price closes near the low and a violent rebound wipes out the loss. | The green candle completely engulfs the body of the prior red candle, signaling full control shift. |
| Hammer | Single-candle bullish reversal | Works well during fast intraday flushes or at support levels where the price rejects a new low immediately. | Long lower wick with a small body near the top shows a strong rejection of selling pressure. |
| Three White Soldiers | Three-candle bullish reversal | Best used after a bounce has already begun, and the goal is to confirm strength with clean trend structure. | Three strong green candles close progressively higher with little to no upper shadows. |
| Bullish Harami | Two-candle bullish reversal | Useful when a trend has started to stall and you want to anticipate a shift before a larger reversal. | A small green candle forms entirely inside the previous red candle’s body, signaling hesitation. |
| Tweezer Bottom | Two-candle bullish reversal | Best used at clear horizontal support where price tests the same low twice and fails both times. | Both candles share matching or nearly identical lows, usually with visible lower wicks rejecting the level. |
Discover more alternatives in our WR Trading free Candlesticks Pattern PDF Download.
What Is The Difference Between The Piercing Line And The Dark Cloud Cover Pattern?
The Piercing Line and the Dark Cloud Cover are direct opposite candlestick patterns. Both are two-candle patterns that rely on a gap followed by a close into the prior candle’s body, but the Piercing Line signals strength returning after a decline, while the Dark Cloud Cover shows weakness setting in after a rally.
Structurally, they follow the same candles but in reverse. The Dark Cloud Cover starts with a green candle, then gaps higher and closes red into the previous range. While both highlight failed momentum, the Piercing Line is a sign of buyers regaining ground, and the Dark Cloud Cover shows buyers losing it.
| Section | Piercing Line | Dark Cloud Cover |
|---|---|---|
| Construction | First Candle: Strong red candle closing near the low.Second Candle: Opens below the first candle’s low and closes above the midpoint of the red body. | First Candle: Strong green candle closing near the high.Second Candle: Opens above the first candle’s high and closes below the midpoint of the green body. |
| Forecast | Signals a possible shift from selling pressure to new bullish momentum. | Signals a potential change from buying strength to renewed bearish control. |
| Type of Pattern | Two-candle bullish reversal pattern. | Two-candle bearish reversal pattern. |
| Trend Prior to Pattern | Forms after a downtrend, where sellers have been in control. | Forms after an uptrend, where buyers are losing strength. |
| Opposite Pattern | Dark Cloud Cover. | Piercing Line. |
What Is The Difference Between The Piercing Line And the Bullish Engulfing Pattern?
The Piercing Line and Bullish Engulfing patterns are both two-candle bullish reversal setups, but the size and structure of the second candle set them apart. In a Piercing Line, the green candle only needs to close above the midpoint of the red candle. That still signals a shift in momentum, but it’s more of a recovery than a full takeover.
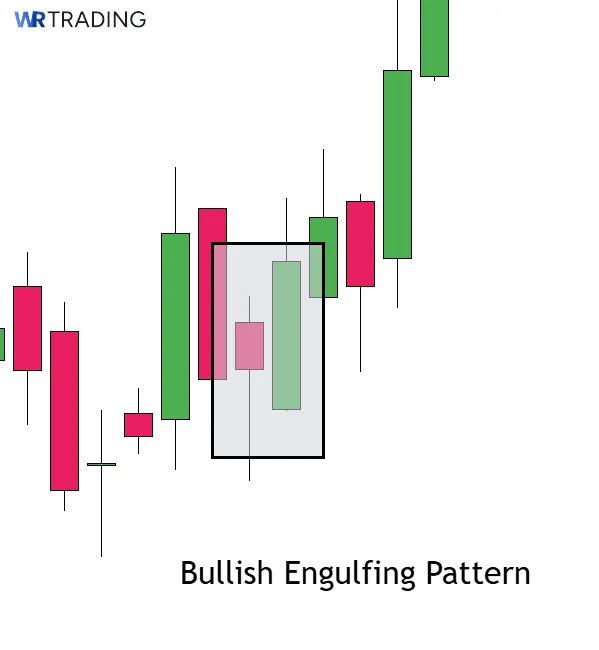
The Bullish Engulfing pattern, on the other hand, requires the green candle to fully engulf the previous red body, showing a much stronger rejection of the prior selling pressure. Another important difference is where and how these patterns form. The Piercing Line often appears in slower or more controlled selling environments, where the price gradually declines into support and then begins to reverse.
However, Bullish Engulfing patterns are more common after sudden, emotional drops where sellers lose control all at once. Because of this, Bullish Engulfing setups tend to be more explosive and aggressive, while Piercing Lines are better suited for identifying early signs of accumulation and quieter reversal points.
| Section | Piercing Line | Bullish Engulfing |
|---|---|---|
| Construction | First Candle: Strong red candle closing near the low.Second Candle: Opens below the first candle’s low and closes above the midpoint of the red body. | First Candle: Red candle, moderate in size.Second Candle: Opens below the red candle’s low and fully engulfs its body with a strong green close. |
| Forecast | Signals a potential bullish reversal with a partial recovery of prior losses. | Signals a stronger reversal with full rejection of the previous session’s price action. |
| Type of Pattern | Two-candle bullish reversal pattern. | Two-candle bullish reversal pattern. |
| Trend Prior to Pattern | Forms after a downtrend or heavy pullback. | Forms after a sharp decline or emotional selloff. |
| Price Behavior | Buyers reclaim over half the red candle but not the entire range. | Buyers completely overpower sellers by closing above the prior session’s open. |
| Opposite Pattern | Dark Cloud Cover. | Bearish Engulfing. |
What Are The Limitations Of The Piercing Line?
The Piercing Line is useful in many situations, but it has clear limitations that reduce its reliability in certain market conditions. These are the main limits of the pattern:
- The pattern only reclaims half the prior candle, which may not be enough to shift momentum.
- It loses meaning if there’s no clear downtrend before it forms.
- Markets like forex and crypto don’t always show clean opening gaps, which are part of the setup.
- Compared to engulfing patterns, it offers less confirmation and weaker follow-through.
- Reversals often fail when the price runs into resistance immediately after the pattern completes.
Learn Pattern Trading With the WR Trading Mentoring
Learning how to trade candlestick patterns like the Piercing Line becomes much more effective when you combine technical knowledge with real market experience. That’s exactly what the WR Trading Mentoring program is built to offer. It’s not just theory or surface-level guidance – you get live training, personal feedback, and hands-on chart work that shows you how these patterns behave in different market conditions.
The mentoring is built around structure, precision, and repetition. You’ll learn how to spot high-quality setups, use confirmation tools like volume and indicators, and build complete trading plans around patterns like the Piercing Line.
(Learn To Trade And Read Candlestick Patterns Like A Pro)
Conclusion: The Piercing Line Is a Practical Pattern for Catching Early Reversals
The Piercing Line is not the strongest candlestick pattern, but it plays a valuable role when used in the right context. It helps identify moments when selling pressure weakens and buyers begin to regain control. While it doesn’t offer a significant signal, such as the Bullish Engulfing or Morning Star, it provides early warning of a potential reversal without needing complex confirmation.
It forms quickly, gives you a clear structure for risk, and can be combined with tools like RSI or volume for stronger confirmation. When used with patience and proper filtering, it becomes a reliable addition to any pattern-based trading strategy.
FAQs: Most Frequently Asked Questions on Bullish Kicker Pattern
What Makes the Piercing Line a Valid Pattern?
The Piercing Line is valid when the green candle opens below the red candle’s low and closes above its midpoint. Both candles must have real bodies and reflect a clear shift in momentum. Without these conditions, the structure is not considered complete.
Which Timeframe Is Best for Trading the Piercing Line?
The pattern performs best on the daily chart but also works well on the four-hour timeframe. Shorter timeframes tend to produce more noise and false signals. Higher timeframes provide cleaner structure and stronger momentum.
What Increases the Success Rate of the Pattern?
A clean setup near support, rising volume, and confirmation from indicators all improve the outcome. The more aligned the conditions, the higher the probability. Avoiding poor locations like ranges or weak trends also helps.
What Are the Most Common Mistakes With The Piercing Line?
Entering too early, ignoring context, or trading it inside a range are common issues. Many traders also overlook nearby resistance, which often stops the move. Quality setups come from filtering, not just recognizing the shape.