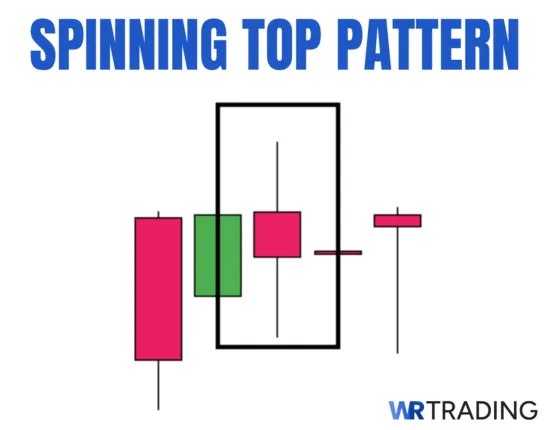
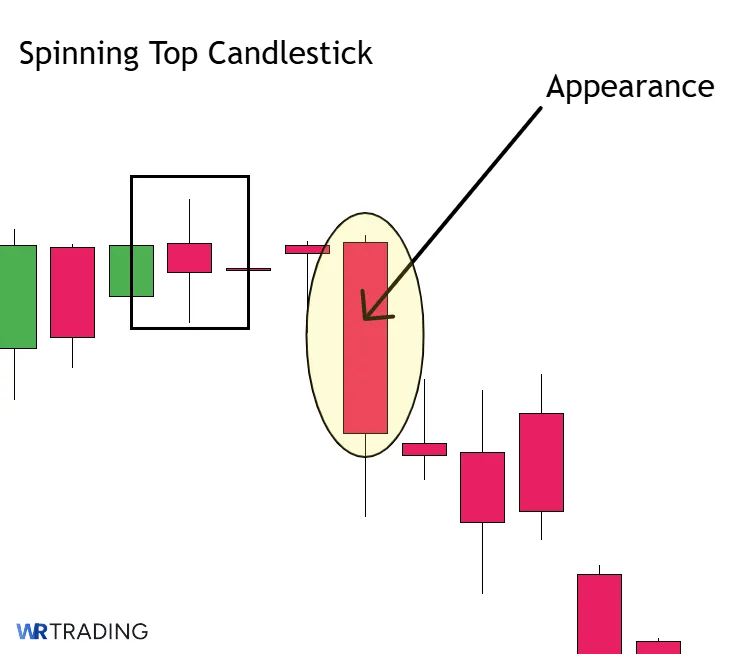
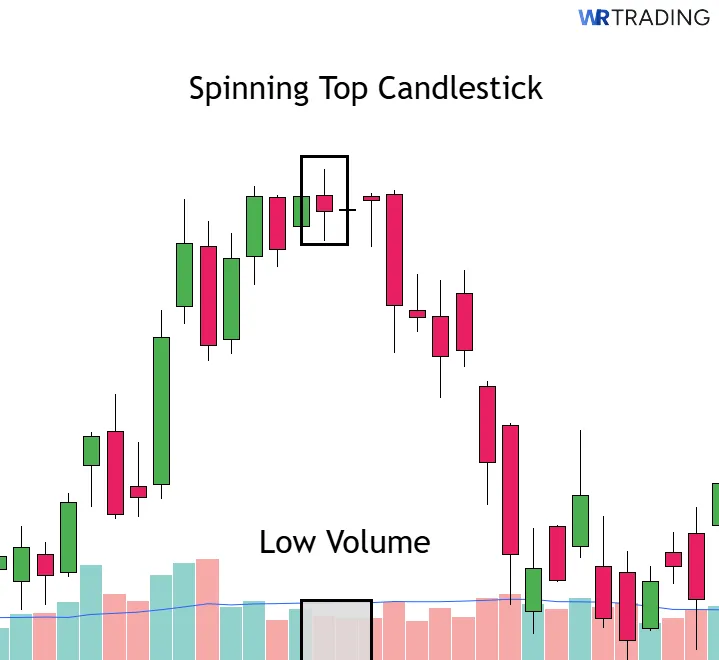
A spinning top candlestick pattern is a small-bodied candle with long upper and lower wicks, signalling market indecision. It typically appears after significant price movements and reflects a temporary equilibrium.
The pattern can form during an uptrend or a downtrend, often indicating a potential reversal or a pause in momentum. While not a standalone signal, it can signify important turning points when paired with other indicators.
In this guide, the meaning of the spinning top will be clearly explained, along with visual examples and key methods for using it in markets like forex. Whether you’re new to candlestick reading or refining your trading strategy, you’ll find our insights will help improve timing and decision-making.
We’ll also break down how accurate the pattern is, when it works best, and how traders build it into complete systems.
Key facts about how the Spinning Top is structured:
- Main Candle: Small body candle (red/green) centered between long upper and lower wicks
- Type Of Pattern: Neutral
- Trend Prior The Pattern: Bullish or bearish
- Entry Options: confirmation after spinning top; breakout during confirmation candle; retest after confirmation candle; indicator-assisted
- Stop-Loss Placement: stop loss above/below the spinning top
- Psychology: signals a balance between buyers and sellers
- Success rate:53-55%
(Learn To Trade And Read Candlestick Patterns Like A Pro)
What Is A Bullish Spinning Top Pattern?
The bullish spinning top is a green-coloured candlestick with a small body positioned near the center of the candle’s range, along with equal or nearly equal wicks. It appears after a strong bearish move. The market opens and closes near the same level, resulting in a small body.
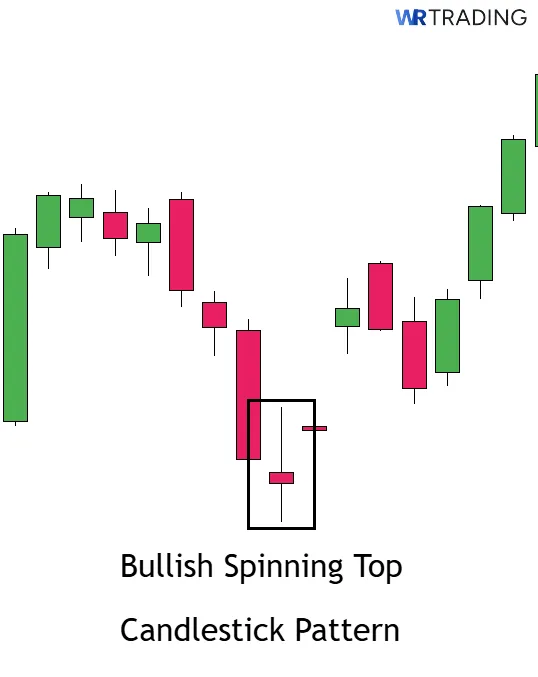
This formation shows us that sellers initially pushed prices lower, but buyers stepped in to push prices back up to a similar area. However, validation happens when the next candle has a large bullish body with little to no shadows.
What Is A Bearish Spinning Top Pattern?
The bearish spinning top is a candlestick with a small red-coloured body and long equal or nearly equal wicks that appears after a bullish move. Like its counterpart, the price opens and closes at about the same level, resulting in a small body.

The bearish spinning top indicates that, although buyers initially held control, sellers countered strongly within the same session. This indicates a potential bearish reversal, which is validated when the subsequent candle has a large red-coloured body.
What Is A Double Spinning Top Pattern?
A double spinning top consists of two consecutive spinning top candlesticks, representing extended indecision, where neither buyers nor sellers have taken full control for two sessions. However, it’s a powerful signal of a potential turning point in price.
(Learn To Trade And Read Candlestick Patterns Like A Pro)
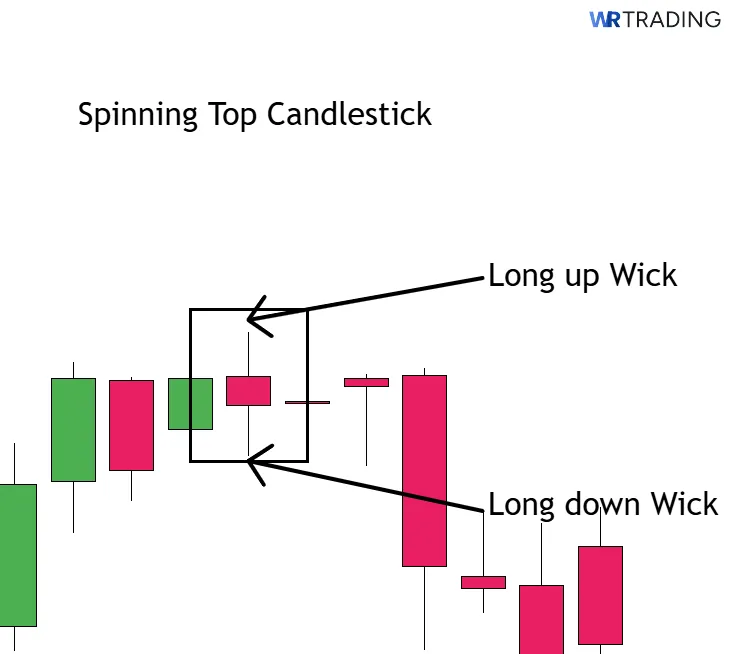
How Is The Spinning Top Pattern Formed?
Spinning tops follow this simple formation process:
- The price opens, then moves up significantly.
- It then moves down significantly, almost as far in the other direction.
- By the end of the session, it closes very close to the opening price.
What appears beforehand depends on whether it’s a bullish or bearish move. In either case, you can expect a variety of candles. However, large or full-bodied candles are telling as a subsequent spinning top usually signals slowing momentum.
Equally critical is what appears after the spinning top. A large candle that closes in the opposite direction hints at a potential turning point. However, if it closes in the previous direction, the spinning top would have merely represented a pause.
Time-wise, the spinning top appears based on the chosen time frame. For example, it would take 30 minutes to form on a 30-minute chart (though the context before and afterwards would play out longer than 30 minutes).
Where Does The Name Of The Pattern Spinning Top Come From?
The name comes from the ‘spinning top’ children’s toy, which shares a visual resemblance.
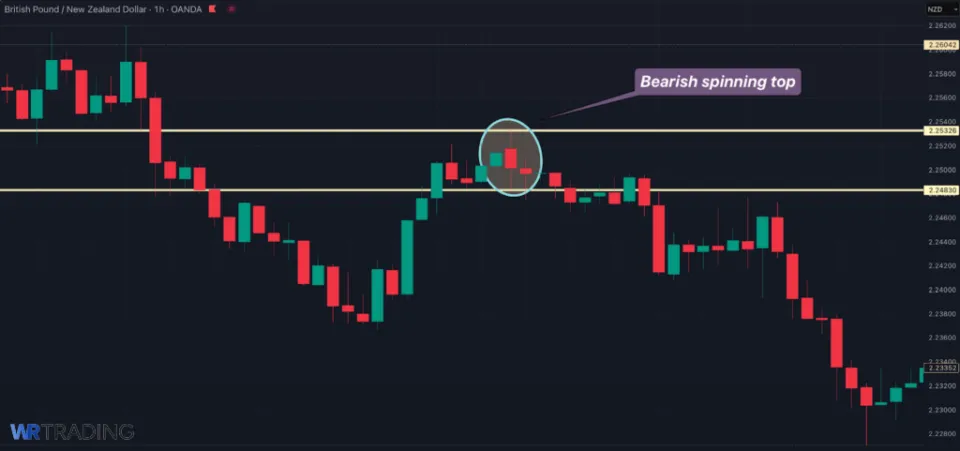
What Is An Example Of The Spinning Top Pattern?
The first example is a red or bearish spinning top on the 1HR chart of GBP/NZD, between the prices 2.25326 and 2.24830. This was a continuation pattern after a retracement in a downtrend.
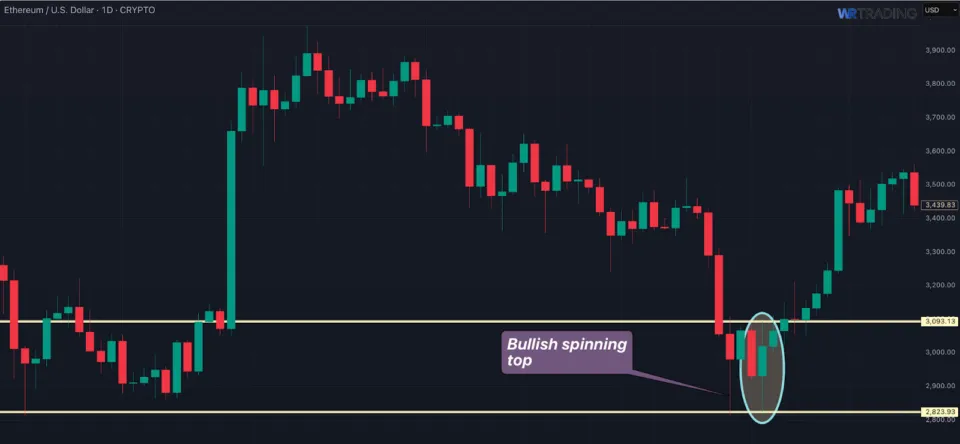
The second and last example is a bullish spinning top on the Ethereum daily chart. It happened between the prices $2823 and $3093. This spinning top caused a minor reversal at a key resistance level.
How To Identify The Spinning Top Pattern
Identifying the spinning top begins with having a strong, clear trend. So, a series of green candles with higher highs and higher lows (for uptrends) or a series of red candles with lower highs and lower lows (for downtrends).
It’s worth noting that spinning tops can appear in range-bound settings, provided there is other notable technical confirmation (but this also applies to trends).
Another consideration should be the time frame, which should ideally be from the 4HR and above. Lower charts will show you more appearances of the spinning top, many of which would be less meaningful and ‘noisier.’
The next step is to confirm the location of the spinning top. Check to see if one or more of these points align, adding more weight to the candle:
- Key support/resistance levels
- Fibonacci retracement areas (ideally 50%-78.6% as they are the deepest levels)
- Other chart patterns like double tops/bottoms and morning/evening stars
- Trendlines/channels
- Bollinger Band extremes
- Moving averages
- Divergence with MACD or RSI
- Multi-time frame analysis (confirming with higher time frame structure)
Finally, here is a checklist to ensure the proper characteristics for the spinning top:
- Real body is small: Open and close are nearby each other.
- Upper and lower shadows are long: Typically at least twice the size of the real body.
- Next candle confirms the signal: Bullish confirmation is signaled by a strong green candle after the spinning Top in a downtrend. Bearish confirmation is signaled by a strong red candle after spinning Top in an uptrend.
(Learn To Trade And Read Candlestick Patterns Like A Pro)
How To Trade The Spinning Top Pattern
Trading the spinning top involves multiple steps for the most effective results:
- Find the proper spinning top conditions
- Wait for the appearance of the pattern
- Open your trade
- Choose the trading take-profit
1. Find the Right Setup For The Spinning Top
The right context is crucial when traders identify the spinning top. Using the previous identification steps, check off this tick box:
- Is there a clear trend? (whether it’s a potential reversal or continuation setup)
- Is the spinning top near a specific key level, such as support/resistance, a trendline, or a moving average?
- Are there any other technical clues like a volume rise or an overextended market?
Once each of these factors is validated, it’s time to wait for the spinning top to form completely.
2. Wait For The Appearance Of The Spinning Top Candlestick Pattern
Traders should refer to the checklist in the previous section to ensure a perfect spinning top. In summary:
- The wicks are almost (or precisely) equal and at least twice the size of the body
- After the spinning top is complete, wait for a strong candle (bullish or bearish) with minimal shadows to confirm the signal.
Traders can set alerts for the periods towards the end of the spinning top or confirmation candle appearing (depending on the time frame) to avoid staring at the charts.
3. Open Your Trade – Entry Point
Here are the various types of methods (with stop loss) to use when entering the spinning top setup.
Confirmation Entry
We have briefly mentioned this technique (waiting for the next candle after the spinning top before entry). It’s arguably the most balanced way to enter the pattern. The stop loss should be placed below the low or above the high of the spinning top.
Breakout Entry
This is an aggressive entry where you enter while the confirmation candle is forming. So, a trader would enter on the break of the spinning top’s high or low, depending on the anticipated direction.
While a risky approach, it offers the tightest stop and greater reward potential.
- Bearish entry: Price breaks below the low of the spinning top
- Bullish entry: Price breaks above the high of the spinning top
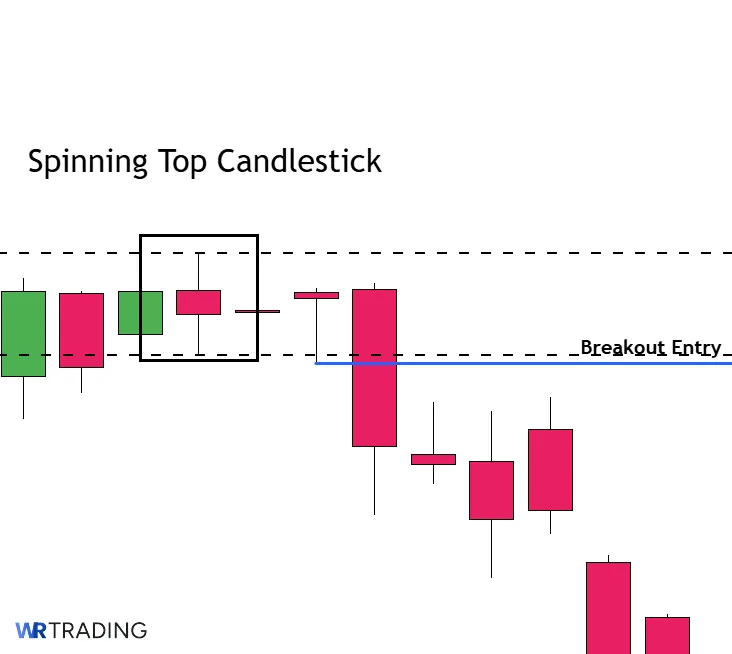
Alternatively, you could use a pending buy/sell order a few pips beyond the high/low, which is slightly safer than a manual entry. The stop loss should be above or below the opposite end of the spinning top.
Retest Entry
Here, one waits for the confirmation candle and then a retest, ideally within 50% of the spinning top’s range. This approach offers the tightest entry and higher reward potential, albeit at the risk of potentially missing the trade since there is no guarantee of a pullback.
The stop loss should be above the high or below the low of the spinning top.
Indicator-Assisted Entry
A more mechanical approach is to implement an indicator-assisted entry. Here are a few ideas:
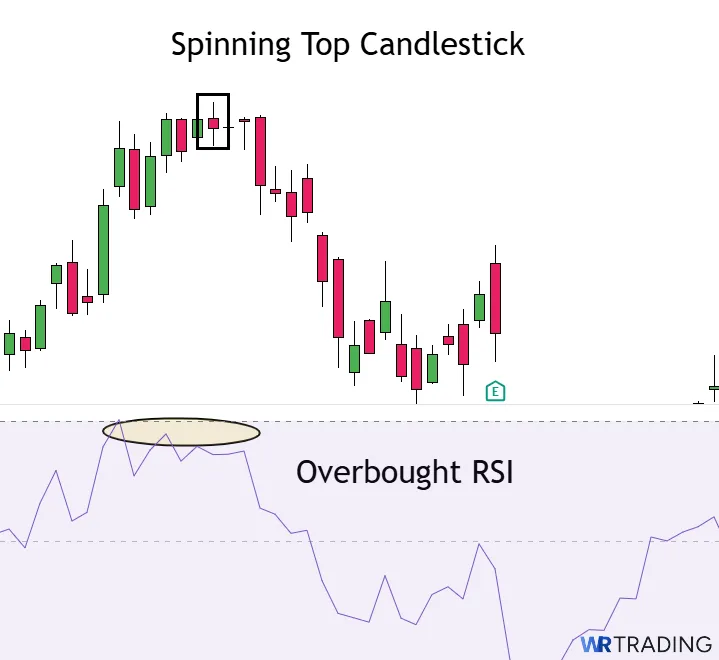
RSI:
- Entry Strategy: Look for a spinning top when RSI is in extreme zones (below 30/oversold for long entries or above 70/overbought for shorts). Enter on the next candle that confirms a reversal.
- Stop-Loss: Place the stop-loss just below the low or above the high of the spinning top.
MACD:
- Entry Strategy: Wait for a MACD line crossover in the same direction as the anticipated reversal, ideally within 1–3 candles of the spinning top.
- Stop-Loss: Use a stop-loss outside the spinning top’s wick.
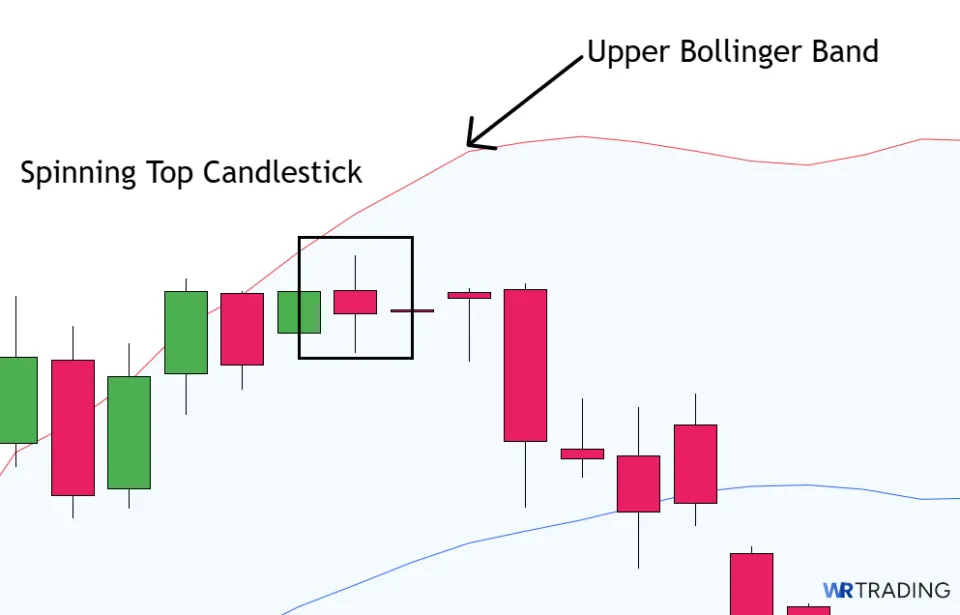
Bollinger Bands:
- Entry Strategy: A spinning top forms on or near the upper or lower Bollinger Band, followed by a candle indicating a reversal. Enter in the direction of the reversal.
- Stop-Loss: Set the SL just beyond the spinning top wick and the band itself.
Moving Averages (MA):
- Entry Strategy: If the spinning top appears near a key moving average (e.g., 50 EMA, 200 EMA), enter upon confirmation that price is rejecting that level.
- Stop-Loss: Place the SL just beyond the moving average or below/above the spinning top’s swing point.
(Learn To Trade And Read Candlestick Patterns Like A Pro)
4. Choose Your Trading Take Profit
Assuming you remain in the position after the entry (and the price is moving favourably), how do you take profits? There are various ways, depending on numerous factors like the trading style and the market dynamics that occur while your trade is live:
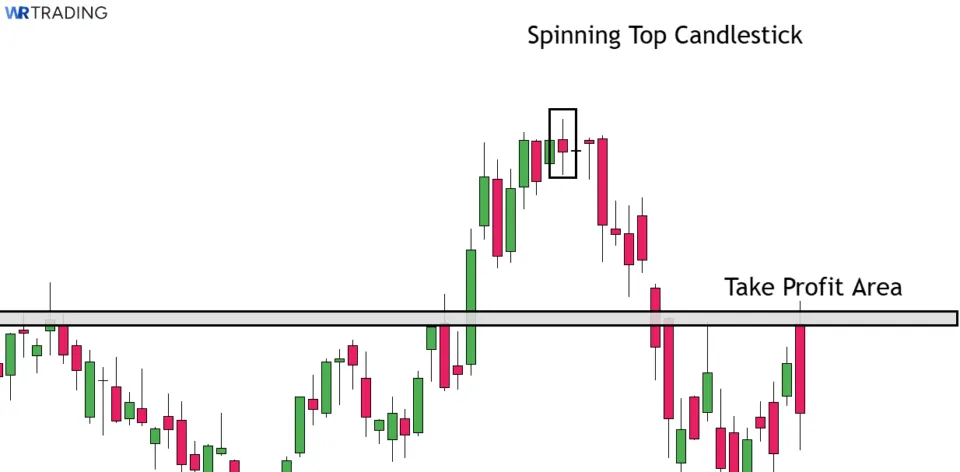
- Targeting key support and resistance levels: Using support/resistance is a time-tested approach to take profits. Naturally, the market stalls and reverses at these levels, making it the ideal time to exit (or at least partially exit).
Traders will mark the key support or resistance levels using a higher time frame and target whichever one is nearby to maximize their profit.
- Fibonacci: Fibonacci is another form of support and resistance using maths, allowing you to identify logical targets. Traders can choose standard retracements, such as 61.8% and 50%, or aim for further distances using the extension levels (e.g., 127.2%, 161.8%, etc.).
- Trailing stop loss: This is a dynamic exit strategy where a trader trails their stop loss. It’s particularly effective in a fluid, trending move where you can trail with minimal pullbacks, keeping you in the trade as long as possible. One can trail their stop in various ways, like using a fixed pip amount, a moving average, or the Average True Range.
- Scaling out: Rather than committing to a single exit point, some traders prefer to scale out of their position gradually. This involves taking partial profits at key milestones, like a 1:1 risk-reward ratio or the next resistance level, while leaving a portion of the trade open.
Partial exits can be particularly useful with the spinning top, since this pattern often marks indecision. It gives you flexibility in case the market follows through for a short time and then reverses again.
- Chart pattern-based targets: Sometimes, a spinning top appears as part of a larger technical pattern, like the end of a flag, wedge, or double bottom. Here, it’s possible to use the measured projection of the larger pattern to define your take-profit level.
For example, if a spinning top forms just as price breaks out of a falling wedge, you might use its height to estimate the upside target. This is a more advanced strategy that requires experience in pattern recognition, but it can offer higher-probability targets when the setup aligns.
Regardless of the chosen method, traders should aim for a minimum 1:3 risk-to-reward ratio when trading. Let’s now review a few examples that incorporate some of these concepts in this section.
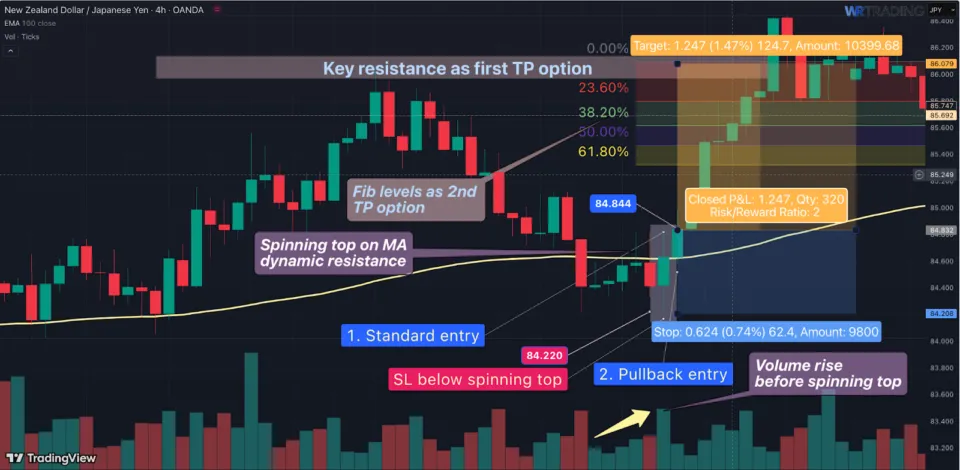
The first example is on the 4HR chart of NZD/JPY and is a trend continuation setup. Here, we have a 100-period MA to reflect the trend. The first key signal is that the spinning top landed on the moving average, reflecting ‘dynamic’ resistance.
Another technical clue was the rise in volume before the spinning top. Additionally, the candle appeared at a minor support level.
Traders could have entered this position with a standard entry (at 84.844) or a retest/pullback entry. In either case, the stop would have been at 84.220.
We see the key resistance level as a notable price target, where the price exceeded this point (offering a 1:2 trade). Alternatively, traders could have used different Fibonacci levels (if they used the pullback entry to gain the most reward).
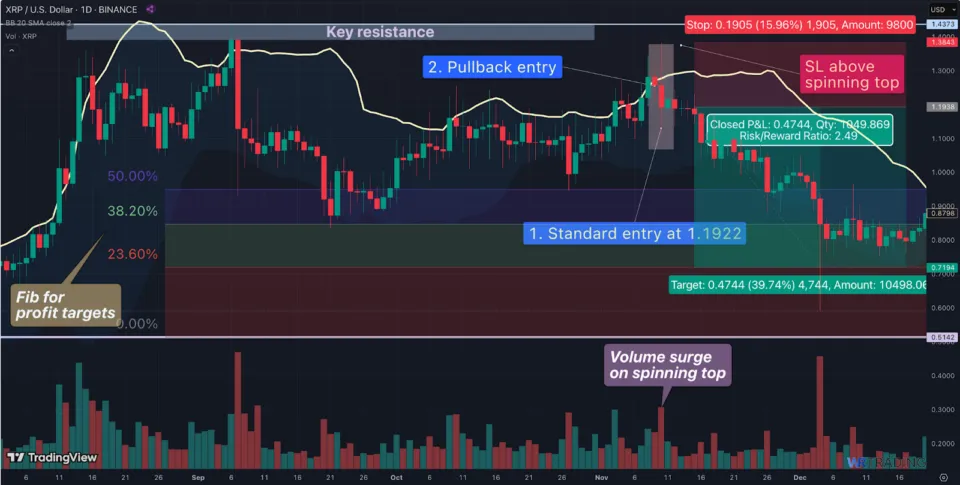
The final example is a reversal on the XRP daily chart. The first notable aspect is the spinning top aligning with an upper Bollinger Band extreme. The same extreme occurred at two prior points near a key resistance, which would have been another strong hint.
Also, the volume increased notably (compared to the previous bars) after the spinning top formed.
As with the last trade, a trader could have entered using the standard or pullback entry with a stop loss above the candle. The Fibonacci would have provided numerous targets. An exit at the 23.6% level would have offered a 2:49 risk-to-reward.
What Is The Success Rate Of The Spinning Top Candlestick Pattern?
Research by Liberated Stock Trader (which looked at 9,894 spinning tops on 568 years of data) indicates that the pattern is 55% accurate. This is consistent with The Predictive Power of Candlestick Patterns in Financial Markets report by the TARE, which suggests 53-54% success rates.
These statistics reflect a modest, practical hit rate. In learning how to trade the pattern, the spinning top setup should be complimented by numerous factors:
- Market context: The pattern gains significance when it appears after a pronounced uptrend or downtrend, potentially indicating a reversal.
- Confirmation candles: Strong bullish or bearish candles that follow a spinning top usually increase the likelihood of a trend change.
- Volume Levels: Higher trading volumes during the formation of the spinning top can enhance its reliability.
- Support and resistance levels: These zones are crucial in increasing the spinning top’s predictive power to some extent, as they represent key turning points.
- Time Frames: The spinning top is a frequently occurring candle. So, the lower the interval, the less meaningful it becomes. Hence, higher times are generally more reliable.
- Confirmation Indicators: Using tools like RSI or MACD alongside the spinning top can provide additional confirmation.
Is The Spinning Top Candlestick Pattern Suitable For Beginners?
Yes, the spinning top is quite suitable for beginners. Firstly, it’s straightforward to identify, as it’s a single candle with a familiar structure.
However, the one challenge is that a beginner may only trade based on seeing the spinning top without considering other factors. It’s meant to be taken as a hint, not a standalone signal. Another challenge is that a newbie could mistake other candles for spinning tops, given the potential similarities. So, it takes experience to distinguish this pattern from others.
Ultimately, the spinning top lays the groundwork for a beginner to understand price action and eventually learn more complex formations.
(Learn To Trade And Read Candlestick Patterns Like A Pro)
What Are The Pros And Cons Of The Spinning Top Pattern?
Here is a brief summary of the pros and cons of this pattern before exploring each one in more detail:
Pros
- Signals market indecision
- Useful at turning points
- Frequent appearance
Cons
- Weak signal in isolation
- Relatively low success rate
- Easily confused with similar candles
What Are The Advantages Of The Spinning Top Pattern?
The main advantages of the spinning top include its ability to show indecision, how it’s used for turning points, and the pattern’s high frequency:
- Indecision signal: The spinning top shows the balance between buyers and sellers, indicating that the price moved in both directions but settled near the open. This accurate visual signal helps traders identify when momentum is slowing down.
- Useful at potential turning points: Spinning tops often act as early warnings of a possible reversal. Traders use this to improve how they anticipate trend changes.
- High frequency: Spinning tops appear quite often on all time frames due to their simple formation. This means that identifying the pattern is straightforward and appeals to a wide range of trading styles.
What Are The Disadvantages Of The Spinning Top Pattern?
Equally important is highlighting the spinning top’s limitations, which include its weakness in isolation, a relatively poor hit rate, and similarity to other candles.
- Weakness in isolation: Ultimately, the spinning top is only one candle, making it hard to rely on it alone. The pattern requires a far greater combination of additional indicators than other setups.
- Relatively poor success rate: Unlike other patterns like the harami and three outside down (with hit rates above 65%), the spinning top’s accuracy is fairly inferior.
- Similarity with other candles: The spinning top resembles other patterns, such as variations of the doji. There are also other small-bodied, equal-wick candles that you may see during low-volatility periods. Thus, spinning tops can easily be misinterpreted.
Can The Spinning Top Have Failure Signals?
Yes, considering the pattern’s nearly 50-50 success rate. Factors such as an unfavourable market context, lack of confirmation, poor risk management, and other external factors beyond one’s control contribute to the spinning top potentially failing.
However, there are other similar alternatives like the high-wave candle and harami.
Which Indicators Can Be Combined With The Spinning Top to increase its success?
Here are the popular indicators to incorporate when the spinning top has formed to improve its accuracy.
Relative Strength Index (RSI)
Purpose: Measures the speed and change of price movements to identify overbought or oversold conditions.
Integration:
- Overbought/Oversold Confirmation: A spinning top appearing when RSI is above 70 (overbought) or below 30 (oversold) can indicate a potential reversal.
- Divergence Analysis: If the price forms a new high or low that the RSI doesn’t confirm, it may signal a weakening trend.
Ideal Setting: 14 periods (standard)
Moving Averages
Purpose: Smoothens price data to identify the direction of the trend.
Integration:
- Trend Confirmation: A spinning top near a significant moving average (e.g., 50-day or 200-day MA) can indicate a potential support or resistance level.
- Crossover Signals: Combining with MA crossovers can provide additional confirmation.
Ideal Settings:
- 50 EMA for short-to mid-term trend bias
- 100 EMA for longer-term trend context
Volume
Purpose: Assesses the strength of a price move by analyzing trading volume.
Integration:
- High Volume confirmation: A spinning top with high trading volume may indicate a battle between buyers and sellers, potentially leading to a strong move.
- Volume decline: A spinning top with declining volume may suggest a lack of interest, possibly leading to a continuation of the current trend.
Ideal Settings: these would vary depending on the type of volume indicator
Bollinger Bands
Purpose: Measures market volatility and identifies overbought or oversold conditions
Integration:
- Band Touches: A spinning top that touches or breaches the upper or lower Bollinger Band can signal a potential reversal.
- Squeeze Scenarios: During low volatility periods (Bollinger Band squeeze), a Spinning Top may indicate an impending breakout.
Ideal Settings: 20-period SMA, 2 standard deviations
(Learn To Trade And Read Candlestick Patterns Like A Pro)
What Are Similar Patterns To The Spinning Top Pattern?
Here are the similar formations to the spinning top, along with their brief descriptions.
| Pattern Name | Description |
|---|---|
| Doji | A type of candle with a very small or nonexistent body, reflecting nearly exact open and close prices and indecision. |
| High-wave candle | A candle with a slightly larger real body and much longer equal wicks than the spinning top, which represents high volatility. |
| Hammer / Inverted Hammer | A reversal candle with a small body at the upper/lower end and a long shadow, i.e., resembles a dead bow/sledge hammer |
| Bullish Harami / Bearish Harami | A two-bar pattern where a small bar candle is contained within a larger one, indicating a reversal or continuation. |
What Is The Opposite Pattern Of The Spinning Top?
There is technically no direct opposite to the spinning top, as it’s a neutral candle. So, a spinning top in a downtrend is a bearish spinning top, while one in an uptrend is a bullish spinning top.
What Is The Difference Between The Spinning Top And The Spinning Bottom Candle?
Technically, both patterns are identical. The spinning bottom is a term that is sometimes used to describe the bullish version of the spinning top (i.e., a candle forming at the bottom of a downtrend to hint at a potential bullish reversal). However, traders typically use ‘spinning top’ for the same candle structure regardless of the context in which it forms.
Learn Pattern Trading With The WR Trading Mentoring
Mastering the spinning top is essential for identifying market indecision and potential reversals. At WR Trading, our mentorship program goes beyond theory. Through personalized coaching, live trading sessions, and strategy templates, you’ll learn to integrate various patterns into a structured, effective trading system.
Our approach emphasizes high risk-to-reward trades and sharp execution in forex and other markets, helping you build confidence in reading price action and making informed decisions.
(Learn To Trade And Read Candlestick Patterns Like A Pro)
Conclusion: A Rare Gem in Trend Continuation Setups
The spinning top candlestick pattern serves as a vital technical analysis indicator of a potential reversal or pause in the prevailing trend. However, we should reiterate that relying solely on this candlestick pattern often leads to poor trading decisions. Based on our experience, it’s most effective with confirmation from other technical indicators and when considered within the broader market context. Thankfully, traders can explore alternatives like the harami, which are structured more meaningfully.
Regardless, proper risk management strategies, including setting appropriate stop-loss levels and take-profit targets, are essential when trading the spinning top. By integrating this pattern into a comprehensive trading strategy, traders can better anticipate market shifts and make informed decisions.