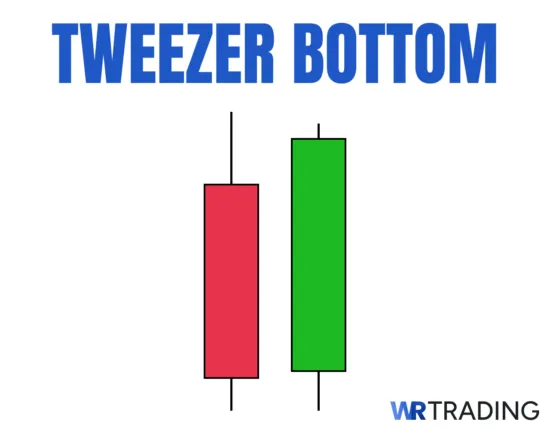
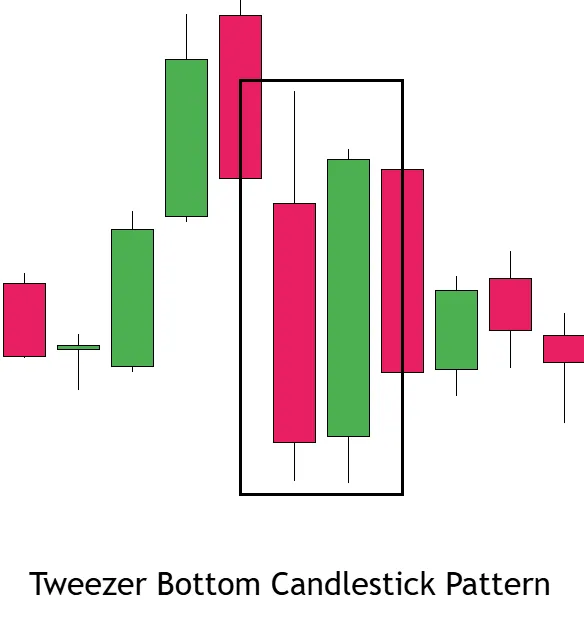
The Tweezer Bottom is a candlestick pattern characterized by two with matching or nearly identical lows, usually presenting at the end of a downtrend. It’s a candlestick pattern that you can use to identify potential bullish reversals in the market. This pattern suggests that selling pressure is waning, and a reversal to an uptrend may be imminent.
The first candlestick is a long bearish (red) candle, reflecting strong selling pressure, while the second candlestick is a bullish (green) candle that opens at or near the same level as the first candle’s low and closes higher)..
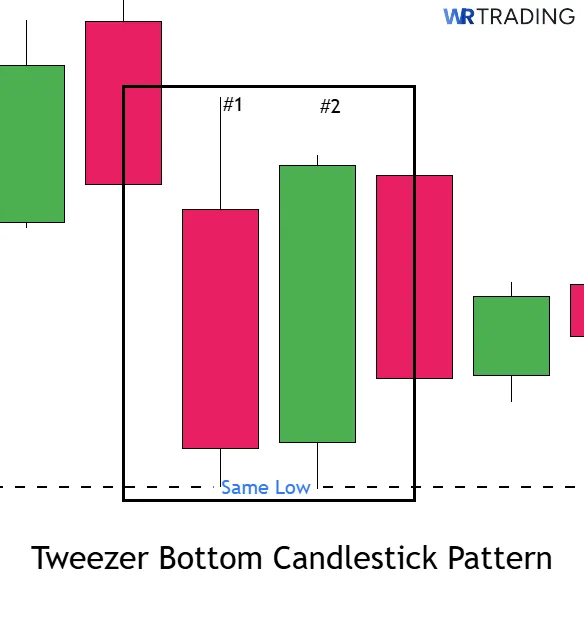
The candles of the pattern share a common characteristic-their lows align at the same price level. This pattern is somewhat versatile, as it can consist of two, three, or more candles, provided all lows align at the same level. The key aspects of the Tweezer Bottom include the following pattern specifications:
Key Facts About The Tweezer Bottom Candlestick Pattern:
- Construction: The Tweezer Bottom Candlestick Pattern is a 2-candlestick formation of two or more consecutive candles with nearly identical lows
- Forecast: The pattern shows a bullish reversal, signaling the possible end of the downtrend.
- Type of pattern: The Tweezer Bottom is a reversal indicator.
- Trend prior to pattern: A bearish trend or recent downward price movement..
- Opposite pattern:. The Tweezer Top Candlestick Pattern
- Stop-loss placement: A common stop-loss level is just below the matching lows of the tweezer formation, giving some room in case of a false breakout.
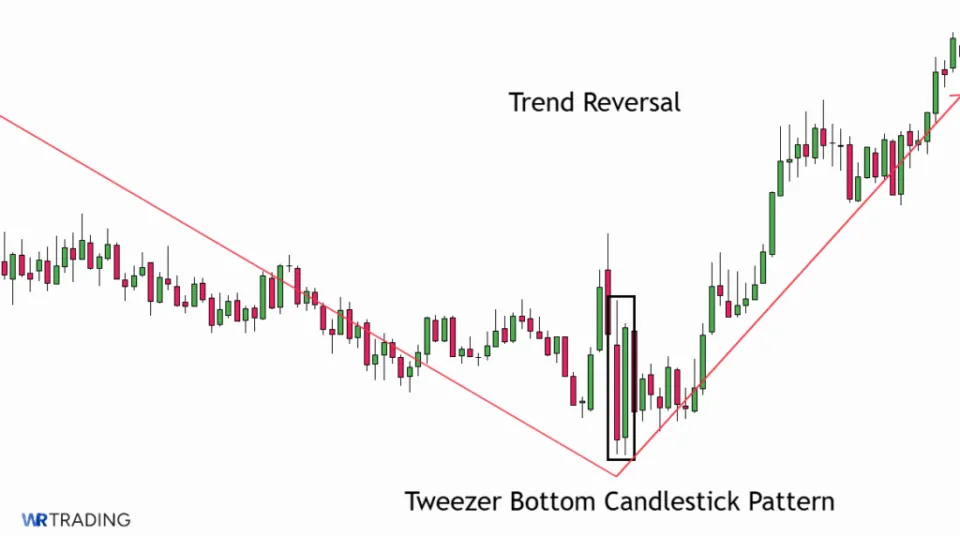
- Location. The pattern usually forms at the bottom of a downtrend or near a support zone, where buying pressure may begin to overtake selling pressure.
- Trend confirmation: For higher reliability, look for additional bullish confirmation (a strong green candle or bullish volume) following the tweezer bottom before entering a trade.
(Learn To Trade And Read Candlestick Patterns Like A Pro)
How is the Tweezer Bottom Pattern Formed?
The formation of the Tweezer Bottom involves a sequence of price movements, where a clear downtrend sets the stage, with prices consistently making lower lows. The first candle is a bearish candle that continues the downward momentum, the second candle is a bullish candle that opens at or near the close of the first candle and closes at or near the high (with its low matching that of the first candle), and the third or additional candles, If present, maintain the common low, solidifying the support level.
In this candlestick pattern, it’s the alignment of the lows that indicates that bears are losing control, and bulls may be preparing to take over. The Tweezer Bottom can be found on daily charts (most reliable), 4-hour or 1-hour charts (useful for swing or short-term trading), and even 15-min or 5-min charts (for scalpers-but with lower reliability)
The pattern is most reliable on higher time frames, like the daily or 4-hour charts, where each candle reflects more comprehensive market sentiment. On lower time frames, such as 15-minute or below, the pattern can still form but is more prone to false signals due to noise and volatility.
Since the Tweezer Bottom consists of 2 candles, the entire pattern spans two consecutive sessions on the chosen time frame (on a daily chart, it forms over 2 days, on a 1-hour chart, it forms over 2 hours, and on a 15-minute chart, it forms over 30 minutes). It’s important that you confirm the signal with other corroborating signs like an RSI divergence, or a bullish volume increase, as well as the support level’s proximity.
A follow-up bullish candlestick (an engulfing or long-bodied candle) is the actual trigger to place your trade-spotting a Tweezer Bottom alone is insufficient evidence of a reversal.
What does the Tweezer Bottom Candlestick Pattern Mean?
Psychologically, the Tweezer Bottom reflects a shift in market sentiment (the first candle shows the strength of the existing downtrend, as sellers continue to push prices lower).
The second candle shows you that sellers’ momentum is weakening, as buyers step in to prevent prices from falling further (the matching lows highlight a strong support level, suggesting that the market is ready to reverse direction).
In short, this pattern signifies that selling pressure is diminishing, and a bullish reversal may be imminent.
(Learn To Trade And Read Candlestick Patterns Like A Pro)
What is an Example of the Tweezer Bottom Pattern?
Consider the following example using the EUR/USD currency pair:
- Day 1: The market is in a downtrend-a bearish candle forms with a low of 1.0635.
- Day 2: A bullish candle emerges, opening at the same area the first candle aroung 1.0701 and closing at 1.1130, with a low matching the previous days at 1.0635.
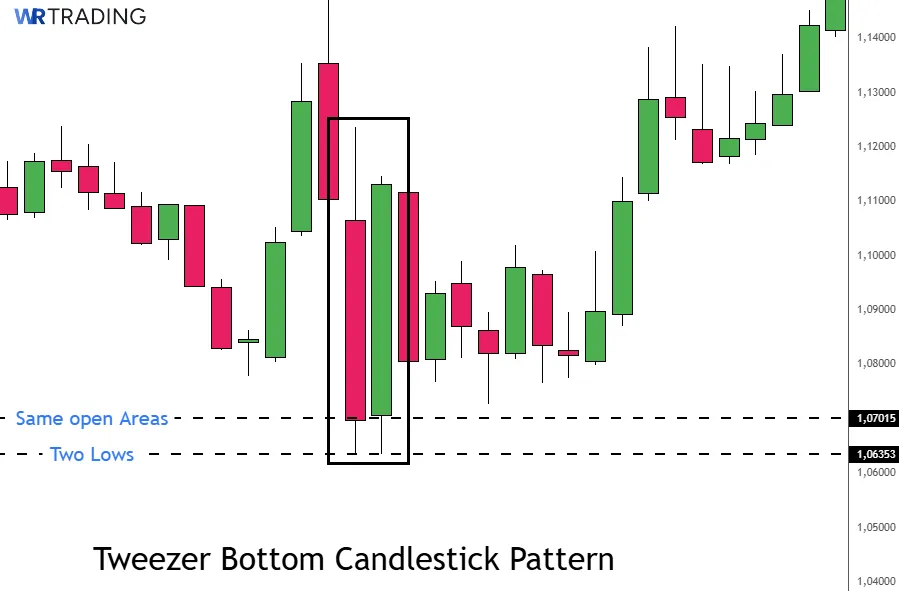
So, the lows of the first, second, and third day align at 1.1000, thus forming a Tweezer Bottom and indicating a potential reversal towards an uptrend.
Is the Tweezer Bottom a Bullish Candlestick Pattern?
Yes, the Tweezer Bottom is considered a bullish reversal pattern, as it appears at the end of a downtrend and suggests that selling pressure is subsiding, with buyers potentially taking control.
It is, however, essential to use this pattern in conjunction with other indicators to confirm its reliability.
How to Identify the Tweezer Bottom Candlestick Pattern?
To identify the Tweezer Bottom, look for the following chart composition:
- Previous trend: Ensure there is a discernible, legitimate downtrend before the pattern presents itself.
- Matching lows: Look for two or more candles with lows at the same price level.
- Candle characteristics: The first candle is typically bearish; the second is bullish, although the exact color and size can vary.
- Location: Search for this pattern at significant support levels (or previous swing lows).
By combining these elements, you increase the pattern’s predictive value, and when confirmed by one or two other technical analysis data points, heighten the likelihood of a true read.
(Learn To Trade And Read Candlestick Patterns Like A Pro)
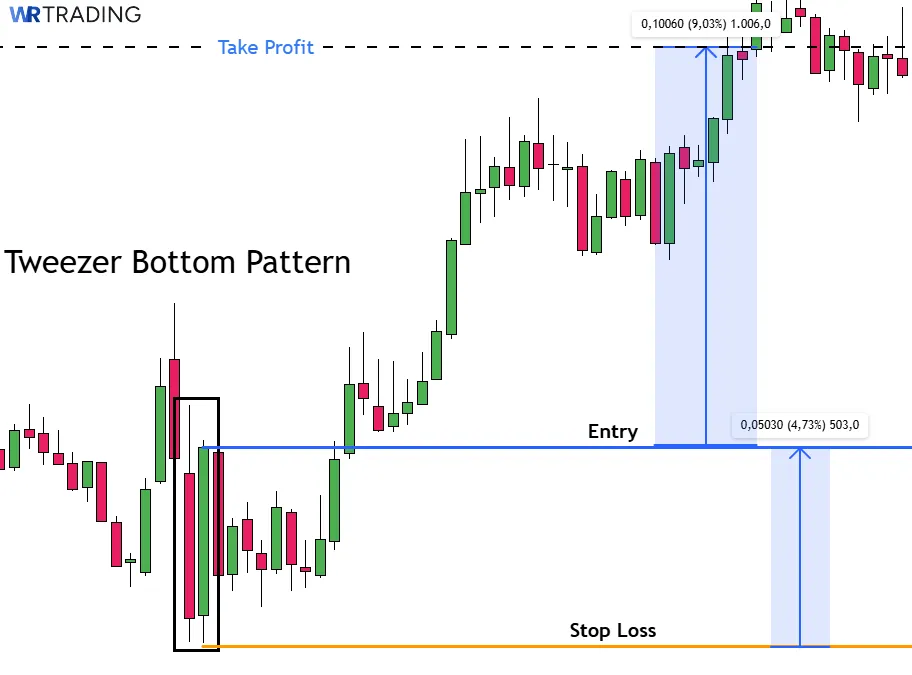
How to Trade the Tweezer Bottom Pattern?
Trading the Tweezer Bottom involves several steps-waiting for the pattern to appear, determining your entry point, and pegging your exit/take profit level.
1. Wait for the Pattern to Appear
Monitor the market for the formation of the Tweezer Bottom at the end of a downtrend. The matching lows of the Tweezer Bottom at a key support level in a downtrend can signal a sentiment reversal.
Finding the right setup for the Tweezer Bottom increases the accuracy of the pattern, and key factors to consider include:
- It occurs after a strong downtrend or near a major support level.
- There is volume divergence (trading volume reduces as the price falls).
- The market shows an exhaustion of selling pressure by other metrics.
- The pattern appears on higher timeframes (4H, Daily) for more reliability.
- It is always ideally combined with other indicators or price action confirmation.
2. Entry Point
When price breaks and closes above the second candle’s high in the Tweezer Bottom, enter your long position (when the price moves above the high of the second candle, this is taken as an initial confirmation of the reversal).

Place your stop-loss just below the low of the tweezer bottom to protect your capital (as this ensures that you exit the trade with minimal losses if the pattern fails and price resumes downward movement).
Use proper risk management (typically risking no more than 1–2% of your trading capital on a single trade) to determine your position sizing, calculating your position size based on the stop-loss distance.
It’s crucial to remember to wait for a green candle closing above previous highs along with the matching bottoms to correctly identify a Tweezer Bottom.
3. Exit/Take Profit Strategy
A conservative take profit approach when trading the Tweezer Bottom will focus on the previous resistance level or recent swing high, while a more aggressive strategy will see you using Fibonacci extensions, or even holding until the trend shows signs of exhaustion.
You can also simply employ a dynamic trailing stop to capture more of the upside, or set a fixed reward-to-risk ratio, such as 2:1.
If you don’t trail your stop, a good exit strategy that limits risk and captures a lot of available gain would simply be to close near the next resistance level or previous swing high.
(Learn To Trade And Read Candlestick Patterns Like A Pro)
What is the Hit Rate of the Tweezer Bottom Candlestick Pattern?
The success rate of the Tweezer Bottom pattern varies between 53% and 65%, depending on the timeframe and asset. Higher timeframes (Daily, Weekly) yield better accuracy and, when combined with confirmation indicators, the rate improves.
Thomas Bulkowski’s candlestick research gave a figure of a 53.1% success rate for Tweezer Bottoms in the context of bullish reversals. Also, tools like MetaStock and TradingView studies show similar ranges when backtested.
The RSI and MACD are excellent for confirmation, especially when showing divergence, and the 50 & 200 EMA are typically dependable corroborators of a Tweezer Bottom play
How Accurate is the Tweezer Bottom Pattern?
Accuracy of the Tweezer Bottom pattern ranges between 50%–65% depending on market context, pattern clarity, and additional confirmation used. It’s a lot more reliable on higher timeframes like 4H, Daily, or Weekly, notwithstanding the fact that dedicated scalpers use it too.
What Are the Pros and Cons of the Tweezer Bottom Pattern?
When it comes to candlestick patterns, it’s important to consider all the advantages and disadvantages. In the following section, you’ll see the pros and cons of the Tweezer Bottom Candlestick Pattern.
Pros
- The pattern is easy to identify visually.
- It indicates strong potential support.
- It works across different timeframes.
- It’s effective in combination with indicators.
Cons
- The Tweezer Bottom pattern can give false signals in ranging markets.
- It needs confirmation from other analysis.
- It displays a lower accuracy on lower timeframes.
- It’s not effective during strong trends.
What are the Advantages of the Tweezer Bottom Pattern?
The Tweezer Bottom pattern is visually distinctive due to the matching lows., and therefore simple to spot on a chart. It’s a strong support signal, showing an area where buyers consistently defend a price level, and it can be used across forex, stocks, crypto, and commodities. The Tweezer Bottom can boost your trading performance when paired with tools like the RSI or MACD.
What are the Disadvantages of the Tweezer Bottom Pattern?
On the flip side, in choppy or consolidating markets, fakeouts are common, and you cannot escape that the pattern needs a prior downtrend (and sometimes additional preliminary confirmation). Apart from ensuring the correct context in which to identify a legitimate Tweezer Bottom, it’s also inconsistent alone, and should never be traded without a proper strategy or system.
Can the Tweezer Bottom have Failure Signals?
Yes-the Tweezer Bottom can give failure signals can occur when:
- The pattern forms in sideways or low-volume markets.
- No confirmation candle breaks the high of the second candle.
- It forms, but price breaks below the common low, indicating pattern failure.
- It’s counter to a strong macro or fundamental trend (risk management and confirmations help you to determine whether you’re witnessing a dominant trend).
Which Indicators Can Be Combined With the Tweezer Bottom?
In order to optimize your hit rate when trading on Tweezer Bottom patterns, several indicators can be used to corroborate a legitimate Tweezer Bottom:

| Indicator | Purpose | Recommended settings |
|---|---|---|
| RSI (Relative Strength Index) | Confirms oversold conditions | 14-period, look for RSI < 30 |
| MACD | Confirms momentum shift | Standard: 12, 26, 9 |
| Bollinger Bands | Identifies price at extreme levels | 20-period, 2 std. dev. |
| Volume | Validates pattern with increased buying | Look for the volume spike on the green candle |
| Moving Averages | Confirms trend reversal | 50 & 200 EMA crossover strategy |
(Learn To Trade And Read Candlestick Patterns Like A Pro)
What are the Alternatives to the Tweezer Bottom Pattern?
There are several alternatives to trading on Tweezer Bottom candlestick patterns, and they include:
- Morning Star: A 3-candle bullish reversal pattern with a strong final bullish candle.
- Bullish Engulfing: The second candle fully engulfs the first bearish candle.
- Hammer: A single candle with a small body and long lower wick, suggesting rejection of lower prices.
What is the Opposite Pattern of the Tweezer Bottom?
The Tweezer Top is the opposite of the Tweezer Bottom Candlestick Pattern.
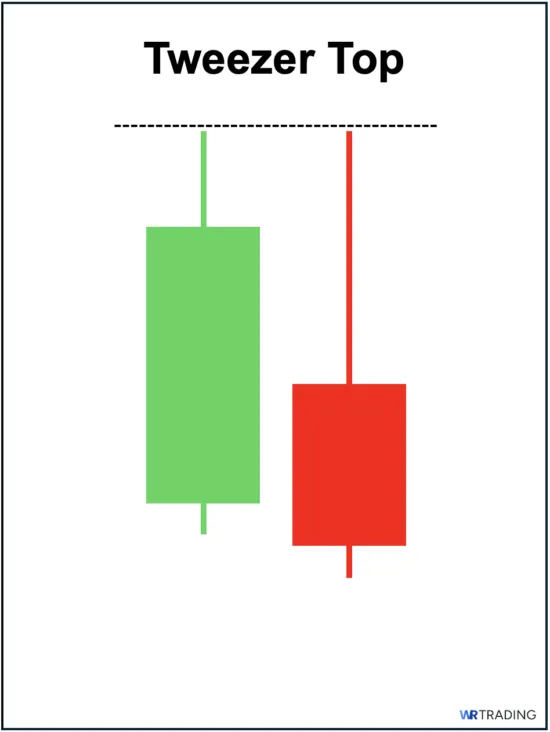
It occurs at the end of an uptrend, with two or more candles showing identical highs, suggesting resistance and a bearish reversal.
What is the Difference Between the Tweezer Bottom and the Tweezer Top?
| Aspect | Tweezer Bottom | Tweezer Top |
|---|---|---|
| Trend Context | Downtrend | Uptrend |
| Direction Signal | Bullish reversal | Bearish reversal |
| Candle Lows/Highs | Matching lows | Matching highs |
| Trader Action | Look to buy | Look to sell |
What are the Limitations of the Tweezer Bottom?
The principal limitation of the Tweezer Bottom is that it lacks strength in isolation; it requires confirmation.
Moreover, further limitations include:
- It doesn’t indicate the magnitude of the reversal.
- It may repaint or become invalid with new candles.
- It also doesn’t work well in low-volume or manipulated markets.
- And it requires a clear context of a prior downtrend in order to be considered legitimate.
Learn Pattern Trading with WR Trading Mentoring
Ready to master candlestick patterns like the Tweezer Bottom and a great many others to up your trading game? WR Trading Mentoring offers 1-on-1 guidance, live market analysis, and a tested methodology to help you identify, trade, and profit from patterns like this.
We’ll show you how to connect your knowledge with execution and join hundreds of traders who’ve learned to turn patterns into profits. Click here to enroll in our mentorship today, and truly transform your trading into a genuinely profitable activity.
(Learn To Trade And Read Candlestick Patterns Like A Pro)
Conclusion: Mastering Reversals with the Tweezer Bottom Pattern
The Tweezer Bottom pattern, while simple in appearance, carries significant meaning in the right context. It reflects a battle between bulls and bears, where the bulls begin to wrestle back control after a steady price decline and, whether you’re a day trader or swing trader, this pattern can become a key tool in your setup arsenal.
To use it effectively and profitably, you’ll need to combine it with strong confirmation indicators, focus on key support levels, and always manage your risk effectively (this means both correct initial interpretation as well as non-negotiable stop-losses).