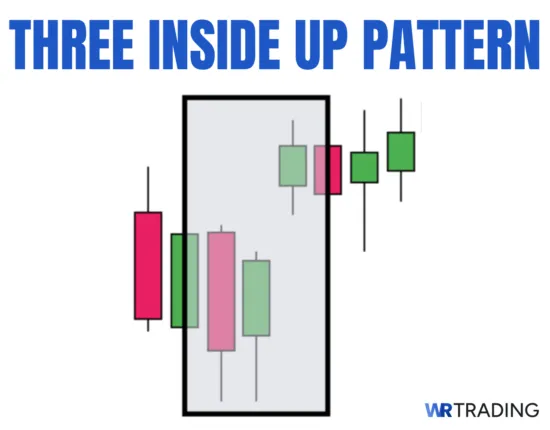
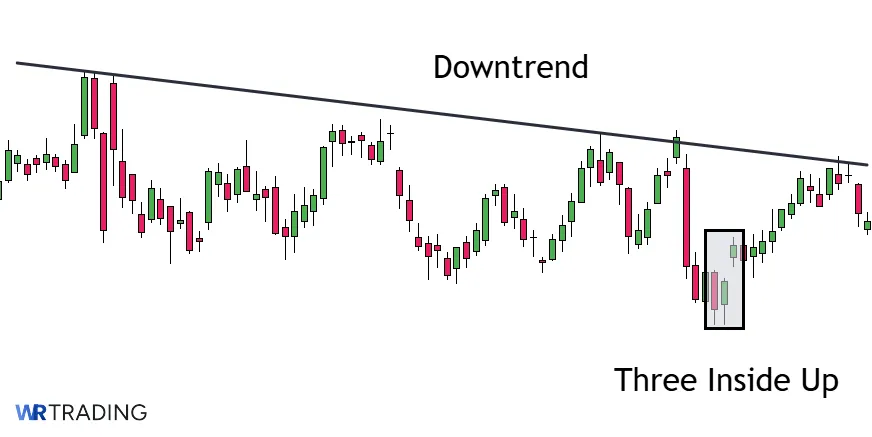
The Three Inside Up is a three-candle bullish reversal pattern that appears at the end of a downtrend and signals a shift in control from sellers to buyers. The pattern forms when a bearish candle is followed by a smaller bullish candle inside its body, and then a third bullish candle that breaks above the high of the first. This structure confirms buying momentum and potential trend reversal.
This guide will break down the structure, formation, and meaning behind the Three Inside Up pattern. We’ll also walk through real chart examples, how to identify and trade the setup, confirmation tools to boost accuracy, and what makes this pattern work best in forex, crypto, and CFD markets.
Key Facts of The Three Inside Up Pattern:
- Construction:
- First Candle: Strong red candle
- Second Candle: A fairly large green candle within the range of the first candle (red candle
- Third Candle: A large green candle that closes above the high of the first red candle
- Type of Pattern: Reversal
- Trend Prior to the Pattern: Bearish
- Opposite Pattern: Three Inside Down
- Entry Options: Entry after the confirmation candle; entry after the third candle in the pattern; retest entry
- Stop-loss placement: Below the low of the pattern’s low; below the first candle; below the most recent swing high
- Interpretation: The Three Inside Up means that buyers are gaining momentum over sellers. The second candle in the pattern shows the gradual shift of control from sellers to buyers, especially when there is a volume spike on the second candle relative to the first candle in the pattern.
(Learn To Trade And Read Candlestick Patterns Like A Pro)
How Is The Three Inside Up Pattern Formed?
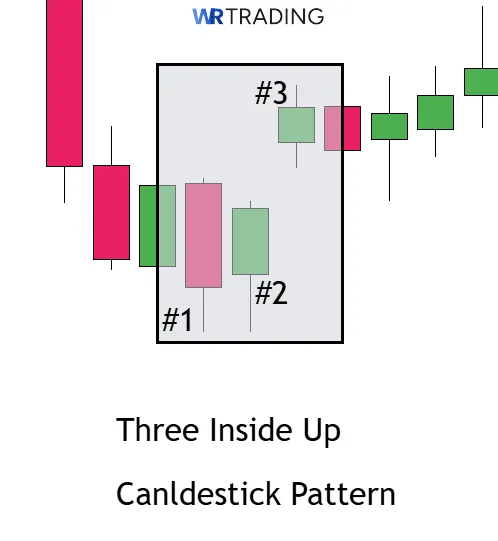
The Three Inside Up pattern forms during a downtrend and requires three specific candles to signal a potential reversal. The pattern appears when bearish momentum starts to weaken and buyers begin stepping in with enough strength to shift direction.
Here’s how the formation works on the chart:
- First Candle: A large red candle forms in a clear downtrend. This candle represents continued selling pressure and sets the tone for the setup.
- Second Candle: A smaller green candle appears next. Its entire body must fit within the body of the first red candle. This signals hesitation from sellers and early signs of buyer interest.
- Third Candle: A full-bodied green candle closes above the high of the first candle. This is the confirmation candle that shows buyers have taken control.
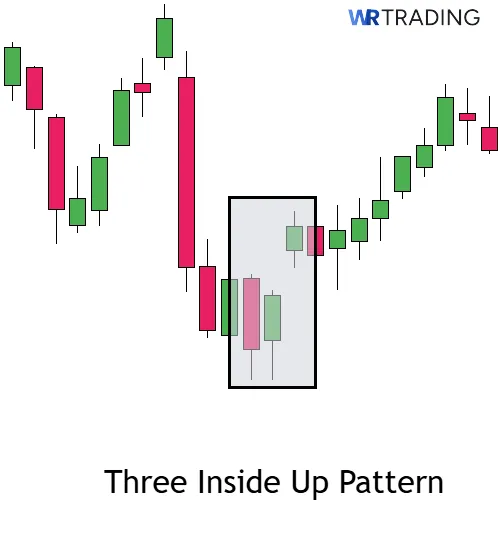
The Three Inside Up pattern does not require a fixed number of candles before it forms. What matters is the preceding trend. It must be bearish. The pattern can form on any timeframe: 1H, 4H, daily, or weekly, but higher timeframes generally provide more reliable signals. After the pattern completes, traders often wait for a confirmation candle or use technical indicators to validate the reversal before entering trades.
What Does The Three Inside Up Candlestick Pattern Mean?
The Three Inside Up candlestick pattern signals a bullish reversal. Psychologically, this setup shows a shift in sentiment from fear to opportunity.
The first candle confirms strong selling pressure, usually driven by momentum traders or panic exits. When the second candle forms inside the first, it reflects hesitation, meaning that sellers are no longer in full control and buyers are starting to defend price. This is often where institutional traders begin accumulating positions quietly.
A third candle will typically signify how good the setup is. When it closes above the first candle’s high, it confirms that buyers have overwhelmed sellers. We view this pattern as a momentum shift with intent. It often traps late sellers who entered at the bottom, forcing them to exit as price moves against them. That adds fuel to the reversal. Simply put, the Three Inside Up tells us one thing: that buyers are back in charge.
(Learn To Trade And Read Candlestick Patterns Like A Pro)
What Is An Example Of The Three Inside Up Pattern?
A clear example of the Three Inside Up pattern appeared on the EUR/USD 1H chart on September 03, 2024.
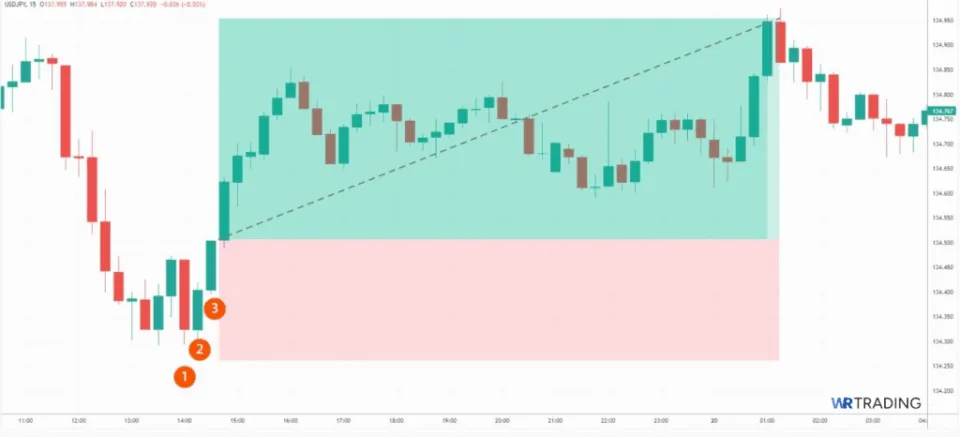
- First Candle (Bearish): EUR/USD was in a short-term downtrend. The 1-hour candle opened at 1.10394 and closed at 1.10281, forming a strong red body with minimal lower wick. Sellers were in full control.
- Second Candle (Inside Bullish): The next candle opened at 1.10282 and closed at 1.10380, forming entirely inside the body of the previous red candle. This showed a pause in selling pressure and the beginning of buying interest.
- Third Candle (Bullish Confirmation): The third candle opened at 1.10379 and closed at 1.10418, breaking above the high of the first red candle (1.10401). This confirmed the bullish reversal.
This pattern played out near a previous support zone, adding weight to the setup. Price moved sharply higher over the next few sessions, reaching 1.11545, making it a strong reversal signal.
Our trading methods track these types of setups in real time, combining them with structure and confirmation tools to enter high-probability trades.
How To Identify The Three Inside Up Pattern?
Identifying the Three Inside Up pattern requires more than spotting three candles. You need to study price context, market structure, and momentum behavior. Here’s our detailed process:
Step 1: Confirm a Clean Downtrend
Start by checking that price is in a visible downtrend. This means lower highs, lower lows, or at least three consecutive bearish candles. Ideally, the setup occurs near a support level, Fibonacci retracement (0.618 or 0.786), or a psychological price floor like 1.0800 in EUR/USD. The cleaner the trend, the stronger the reversal signal.
Step 2: Spot The First Candle
The first candle should be a strong red body with little to no lower wick. This shows that sellers are still in control and are pushing prices lower with conviction. In our system, we prefer this candle to break short-term structure or push below a recent swing low. This triggers attention.
Step 3: Look For The Inside Candle
Next, a green candle must form entirely inside the body of the first. We check that both the open and close of this second candle are within the red candle’s range. This is where control begins to shift. It’s not enough that price pauses. Volume and wick behavior also matter. A long lower wick on the second candle often signals that buyers are starting to absorb selling pressure.
Step 4: Confirm With The Third Candle
The third candle is the most important. It must break above the high of the first candle and close near its own high. Wicks closed or long upper wicks are not valid. This candle tells us buyers have full control. In our model, we tag this candle with labels like “reclaim candle” or “structure reclaim” because it often breaks back into prior support.
We identify this pattern primarily on the 4H and Daily charts. Lower timeframes (15M, 30M) create too much noise. On 1H charts, we demand confirmation from other indicators before considering the signal valid. On higher timeframes, clean Three Inside Ups are easier to trust, especially when paired with exhaustion or divergence. The best Three Inside Up patterns are:
- Near key support or demand zones
- After news events that fail to push prices lower
- Inside pullbacks on higher timeframe bullish trends
We build watchlists around setups like this. Without this context, the pattern loses its edge.
(Learn To Trade And Read Candlestick Patterns Like A Pro)
How To Trade The Three Inside Up Pattern?
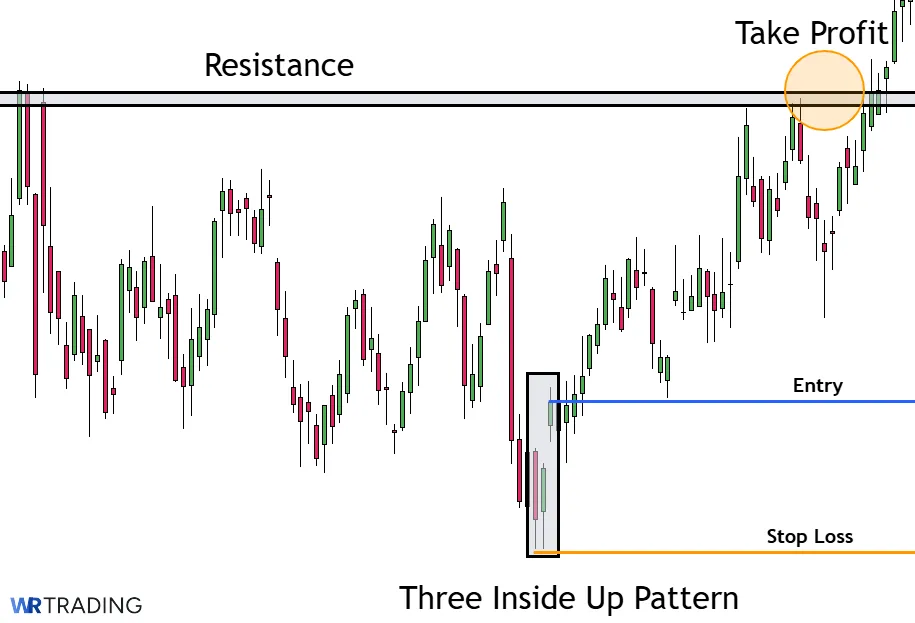
To trade the Three Inside Up pattern, we locate it in a valid context, confirm the signal, plan entry and stop-loss levels, set clear profit targets, and manage the trade using structured logic. Our process is built around five key phases: setup location, pattern appearance, entry, stop-loss, and profit-taking.
Below is a step-by-step guide on how to trade the three inside up pattern:
- Find the right setup for the three inside up
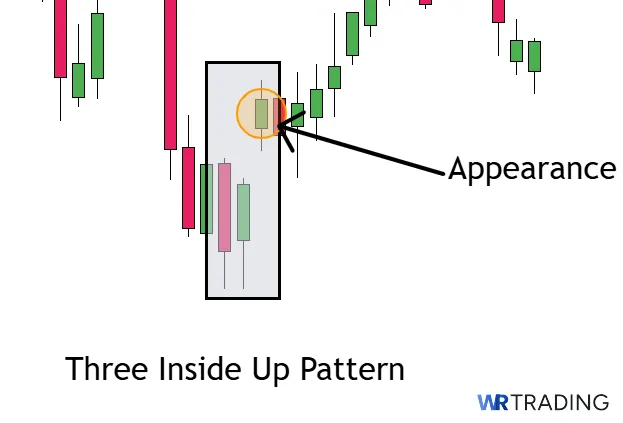
- Wait For The Appearance Of The Three Inside Up Candlestick Pattern
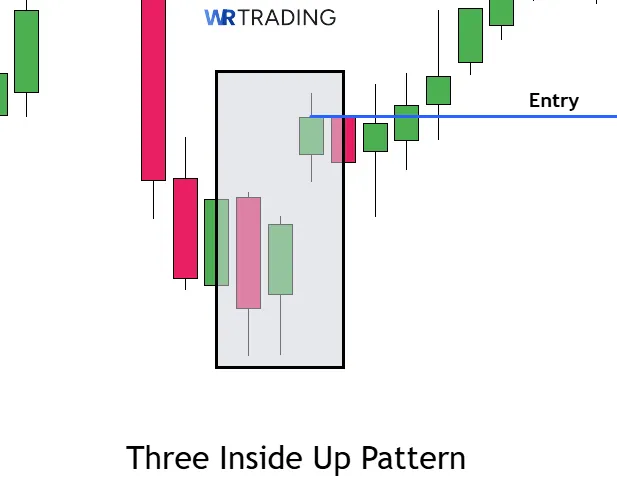
- Open Your Trade – Entry Point
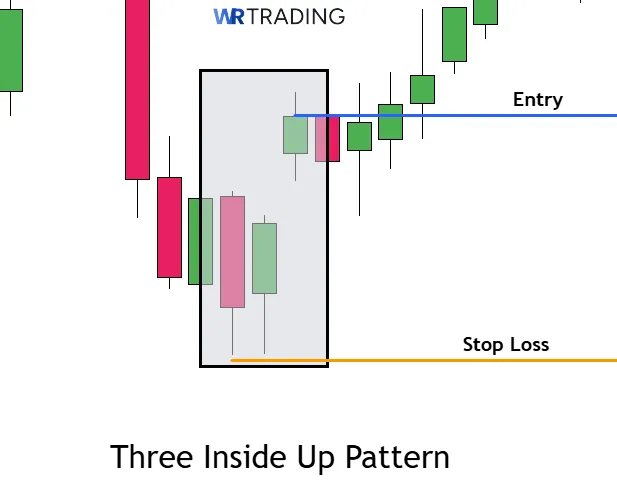
- Setup The Stop Loss
- Choose Your Trading Take Profit
Find The Right Setup For The Three Inside Up
The pattern only works when it forms after a downtrend. Look for price dropping into a major support zone, such as a prior demand level, a 0.618 Fibonacci retracement, or the base of a consolidation range. A valid setup occurs when bearish momentum starts fading. This can show up as weaker red candles, divergence on RSI, or slowing volume.
We never trade this pattern mid-trend. It’s designed for reversals, not continuation plays. It gains more weight when it forms at the end of a three-wave or five-wave drop, or near round-number zones (e.g., 1.0900 in EUR/USD). These are the zones where large buyers often step in.
Wait For The Appearance of The Three Inside Up Candlestick Pattern
Once price reaches the zone, wait for the full pattern to form. The sequence must be clear:
- Large red candle in the downtrend.
- A green candle inside the body of the red candle.
- Final green candle that closes above the red candle’s high.
Do not enter early. Let the pattern complete fully on a closed candle, especially on 4H or Daily charts. Entries taken mid-candle often lack confirmation and increase exposure to fakeouts. Wait for confirmation, not guesses.
(Learn To Trade And Read Candlestick Patterns Like A Pro)
Open Your Trade – Entry Point
The entry comes immediately after the pattern completes. Place a buy stop order a few pips above the high of the third candle. This ensures you’re only triggered if the price continues upward. We recommend avoiding market orders, as they increase slippage and reduce precision.
Your position size should be based on your account size and stop-loss distance. Risk should be a fixed 1% to 2% of total capital per trade. Use a calculator to determine the lot size based on the actual risk distance from entry to stop.
What Can Be a Confirmation of the Three Inside Up Pattern?
Confirmation increases the win rate, and these indicators are our most effective filters:
- RSI Divergence: Price makes lower lows, but RSI shows higher lows (bullish divergence).
- MACD Bullish Crossover: MACD line crosses above signal line after the pattern completes.
- Volume Spike: Third candle closes with higher-than-average volume.
- Break of Trendline: The third candle breaks a descending trendline drawn across recent highs.
We only trade the pattern when at least one of these confirmations is present. This is what separates a visual signal from a professional setup.
Setup The Stop Loss
The stop-loss should be placed below the low of the first red candle in the pattern. This protects the trade in case of invalidation. Do not place the stop inside the pattern because it reduces breathing room and increases false stops.
We also consider ATR (Average True Range) to size the stop. On high-volatility pairs, we may place the stop slightly wider to account for noise, as long as the risk-to-reward ratio remains intact.
Choose Your Trading Take Profit
Profit targets should never be guessed. We calculate them using:
- Previous swing highs from recent structure.
- Fibonacci extensions (1.272 and 1.618 are our favorites).
- Risk-to-reward ratios of at least 1:2 or 1:3. For example, if you risk 30 pips, aim for 60–90 pips in reward.
- Dynamic exit tools, like a trailing stop triggered after price moves 1R in your favor.
We teach our traders the power of consistency. The price doesn’t have to fly, it just has to hit target levels consistently. That’s how we compound over time. This strategy is designed to be all-encompassing. Every part of the setup (context, pattern, confirmation, entry, stop, and exit) is structured. That’s how we turn a common candlestick pattern into a professional trade plan.
(Learn To Trade And Read Candlestick Patterns Like A Pro)
What Is The Success Rate Of The Three Inside Up Candlestick Pattern?
In a research paper published in the Journal of Finance, Andrew W. Lo et al explained that the success rate of the Three Inside Up pattern is 64%.
Meanwhile, in research conducted by Thomas Bulkowski, a leading expert in candlestick pattern statistics, the Three Inside Up pattern has a tested success rate between 65% and 70% when traded under the right market conditions.
Cumulatively, this puts the hit rate of the pattern between 64% – 70%. This places it among the more reliable bullish reversal patterns, especially when confirmed with volume or momentum tools. We found that the Three Inside Up performs best when it forms:
- After a clear downtrend
- Near a strong support level
- With confirmation, such as a breakout or volume surge
According to Bulkowski, the pattern reached its target 68% of the time over a 10-day holding period. However, its accuracy dropped to around 55% when traded without confirmation or in sideways markets.
In our trading plan, we boost this pattern’s success rate by combining it with RSI divergence, trendline breaks, and price reacting off key demand zones. When applied with discipline, the Three Inside Up becomes a high-confidence entry with a measurable edge.
What Are The Pros And Cons Of the Three Inside Up Pattern?
The Three Inside Up is a pattern with clear structure and solid reversal logic, but like every tool in trading, it comes with both advantages and limitations. Below are the key pros and cons at a glance:
Pros
- Visually clear and easy to identify
- Strong reversal confirmation when paired with structure
- Works across forex, stocks, and crypto markets
Cons
- Requires confirmation for reliable execution
- Less effective in choppy or sideways markets
- Can be misread or forced in invalid trend conditions
What Are The Advantages Of The Three Inside Up Pattern?
The following advantages make the pattern a favorite among profitable traders who have mastered the setup.
Visually Clear and Easy to Identify
The Three Inside Up has a clean three-candle layout: a large red, an inside green, and a breakout green candle. This makes it easy for traders to spot even without advanced tools. New and experienced traders alike can use it as a structure-based reversal signal.
Strong Reversal Confirmation When Paired With Structure
This pattern gives high-quality entries when it appears at support levels, after an oversold condition, or near the end of a price leg. When combined with RSI divergence or trendline breaks, it becomes a powerful trigger that fits well into structured trading systems.
Works Across Forex, Stocks, and Crypto Markets
One of the biggest strengths of the pattern is its flexibility. We’ve used this setup on EUR/USD, Bitcoin, and even blue-chip stocks. It adapts well to 4H and Daily charts in all major asset classes.
What Are The Disadvantages Of The Three Inside Up Pattern?
For some traders, these cons are also positives. For others, not so much. Regardless, it is important to know these drawbacks about the pattern:
Requires Confirmation For Reliable Execution
On its own, the pattern is not enough. Without confirmation, like momentum crossover, breakout volume, or structure reclaim, the pattern can fail. This is why we never trade it as a standalone signal.
Less Effective in Choppy or Sideways Markets
In low-volatility environments or consolidations, the pattern loses meaning. A three-candle reversal has no weight unless it forms in the context of a clear downtrend and strong price exhaustion.
Can be Misread or Forced in Invalid Trend Conditions
Traders often force the pattern where it doesn’t belong. For example, spotting it in uptrend conditions or after just one red candle isn’t valid. We teach traders to focus on clean downtrends only, with structure and zone alignment.
Can Three Inside Up Have Failure Signals?
Yes, to a significant degree. The pattern fails most often when it forms:
- Outside of a valid downtrend
- In sideways price action with no momentum
- Without confirmation from indicators or structure
In these cases, the pattern can produce false breakouts, where the third candle closes strongly but price reverses shortly after. One of the biggest failure triggers is a lack of volume behind the breakout candle. When there’s no follow-through, price can snap back, trapping early buyers.
We treat this pattern as a signal, not a trigger. It earns execution status only when the market proves the reversal is real, not before.
(Learn To Trade And Read Candlestick Patterns Like A Pro)
Which Indicators Can Be Combined With The Three Inside Up?
The combination of the Three Inside Up pattern with key technical indicators makes it more accurate and filters weak setups. These indicators help confirm that the reversal is supported by momentum, volume, or market structure, not just candlestick shape.
| Indicator | Setting | Description |
|---|---|---|
| RSI (Relative Strength Index) | 14-period | We use RSI to confirm whether the market is in an oversold condition or showing bullish divergence. When price makes a new low but RSI prints a higher low, it signals that momentum is shifting. A Three Inside Up formation at this point suggests a stronger reversal potential. We look for RSI values below 30 or rising from 30 when the pattern forms. |
| MACD (Moving Average Convergence Divergence) | 12, 26, 9 | MACD helps us detect momentum shifts that support the pattern. A bullish crossover (MACD line crossing above the signal line) after the pattern confirms that buying pressure is building. We also monitor the histogram. Shrinking red bars before or during the pattern often indicate seller exhaustion. |
| Volume Profile or Session Volume | Visible Range or Session Volume tools | Volume matters. A strong third candle with increased volume shows that institutions or large players are stepping in. If the inside bar shows low volume but the breakout candle shows a volume spike, we treat that as solid confirmation. In contrast, low-volume breakouts are red flags. |
| Fibonacci Retracement | 0.382, 0.5, 0.618, 0.786 | We often scan for Three Inside Up patterns forming at key Fibonacci support levels, especially 0.618 or 0.786 retracement zones. When price respects one of these levels and the pattern forms, it adds structure to the reversal. This is particularly effective on 4H and Daily charts. |
| ATR (Average True Range) | 14-period | ATR helps us size our stop-loss based on volatility. If the market is volatile, a wider stop is needed to avoid random noise. We calculate our stop distance using ATR and place it below the low of the pattern’s first candle. This keeps our risk logic consistent regardless of market conditions. |
| Bollinger Bands | 20-period, 2 standard deviations | Bollinger Bands help identify reversal zones. If the pattern forms near the lower band, it often signals that the price is stretched and mean reversion is likely. We use this as a secondary filter to spot exhaustion and prepare for a potential bounce. |
We don’t use all these indicators at once. Our rule is simple: two solid confirmations max. The goal is to use the pattern as a structural clue, then validate it with one or two clean tools that fit the current market context.
What Are Similar Patterns To The Three Inside Up?
The Three Inside Up shares structural similarities with other bullish reversal alternatives. While each has a unique candle formation, they all reflect a shift in market sentiment from bearish to bullish. Below are some patterns often compared with the Three Inside Up.
| Pattern Name | Type | Description |
|---|---|---|
| Morning Star | 3-candle reversal | A red first candle, a small-bodied middle candle (can be green or red), followed by a strong green candle that closes above the midpoint of the first. |
| Bullish Engulfing | 2-candle reversal | A small red candle followed by a large green candle that completely engulfs it. It’s a strong signal of bullish reversal. |
| Piercing Line | 2-candle reversal | A red candle followed by a green candle that opens lower and closes above the midpoint of the first. It suggests strong buyer reaction. |
| Hammer | 1-candle reversal | A single candle with a small body and long lower wick at the bottom of a downtrend, signaling rejection of lower prices. |
| Bullish Harami | 2-candle reversal | A large red candle followed by a smaller green candle, fully inside the first. Similar to Three Inside Up but without the third breakout candle. |
These patterns, like the Three Inside Up, work best in bearish trends and near support zones. They are not interchangeable, but learning to spot them in context gives you more setups in your technical playbook. See more patterns in our free Candlestick Bible PDF.
What Is The Opposite Pattern Of The Three Inside Up?
The opposite of the Three Inside Up is the Three Inside Down pattern. It’s a bearish reversal setup that appears at the end of an uptrend. It begins with a large green candle, followed by a smaller red candle inside it, and then a third red candle that closes below the first candle’s low, signaling a shift from buyers to sellers.
What Is The Difference Between The Three Inside Up And Three Outside Up Patterns?
The Three Inside Up has a green second candle that fits inside the body of the first red candle, showing hesitation and then a breakout. The Three Outside Up, on the other hand, has a green second candle that engulfs the first red candle completely. The third candle in a Three Outside Up confirms the move. Structurally, the Outside pattern is more aggressive and faster to signal.
What Is The Difference Between The Three Inside Up And Three Inside Down Pattern?
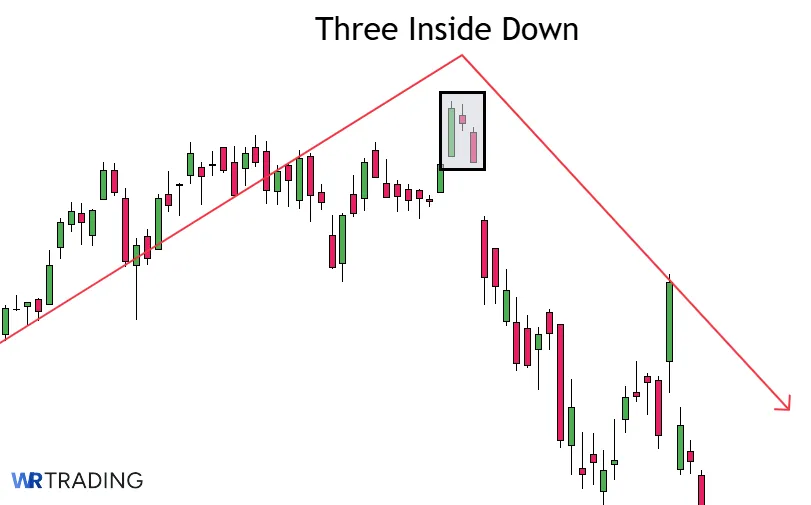
The Three Inside Up is a bullish reversal after a downtrend. The Three Inside Down is its bearish mirror. It forms at the top of an uptrend and includes a red candle inside a green, followed by a third red candle that breaks below the first. Both signal reversals, but in opposite directions and contexts.
What Are The Limitations Of The Three Inside Up?
Some of the limitations of the pattern include:
- False signals without confirmation
- Weak in sideways or low-volume markets
- Relies heavily on proper trend context
- Visual similarity to weaker patterns can cause misidentification.
- Works best with external validation (e.g., RSI, MACD, support zones)
Learn Pattern Trading With The WR Trading Mentoring
At WR Trading, we go beyond pattern recognition. Our mentoring program trains traders to execute setups like the Three Inside Up pattern with risk control, confirmation, and multi-timeframe technical analysis.
Our mentorship includes; Weekly live trade reviews and forecasting, strategy sessions, access to our WR pattern playbook and templates, and one-on-one feedback on trades and strategy development. If you want to trade with precision and avoid guesswork, our mentoring will give you an edge.
(Learn To Trade And Read Candlestick Patterns Like A Pro)